

Hibernate Statistics in Quarkus: Catch N+1 Before Production
Use built-in Hibernate metrics, Prometheus, and tests to detect hidden queries and prevent database overload in real systems.

Most performance problems in JPA applications are invisible until they’re catastrophic. You ship, traffic arrives, and suddenly your database is fielding ten queries where you expected one. Hibernate has had a built-in observability mechanism for years that makes these problems visible during development and in production, and almost nobody uses it.
This tutorial is a complete, end-to-end walkthrough of the Hibernate Statistics API inside a Quarkus application. We will build a small but realistic service, enable statistics, read them programmatically, surface them as a Prometheus-compatible metrics endpoint via Micrometer, and write a test that asserts query counts so you can catch regressions before they reach production.
What We’re Building
A BookstoreResource REST endpoint backed by two JPA entities, Author and Book, with a deliberate N+1 query problem baked in. We will use statistics to surface the problem, fix it, and prove the fix worked using an assertion-level test.
Project Bootstrap
Create the project or start from my Github repository:
quarkus create app dev.mainthread:hibernate-stats \
  --extension=quarkus-hibernate-orm,quarkus-jdbc-postgresql,quarkus-rest-jackson,quarkus-micrometer-registry-prometheus \
  --java=21
cd hibernate-stats
The Domain Model
Two entities. Author has a lazy collection of Book records, the classic setup for an N+1 problem.
package dev.mainthread;

import jakarta.persistence.Column;
import jakarta.persistence.Entity;
import jakarta.persistence.FetchType;
import jakarta.persistence.GeneratedValue;
import jakarta.persistence.GenerationType;
import jakarta.persistence.Id;
import jakarta.persistence.JoinColumn;
import jakarta.persistence.ManyToOne;
import jakarta.persistence.SequenceGenerator;
import jakarta.persistence.Table;

@Entity
@Table(name = "book")
public class Book {

    @Id
    @GeneratedValue(strategy = GenerationType.SEQUENCE, generator = "book_seq")
    @SequenceGenerator(name = "book_seq", sequenceName = "book_seq", allocationSize = 50)
    public Long id;

    @Column(nullable = false)
    public String title;

    @ManyToOne(fetch = FetchType.LAZY)
    @JoinColumn(name = "author_id", nullable = false)
    public Author author;

    public Book() {}

    public Book(String title, Author author) {
        this.title = title;
        this.author = author;
    }
}
package dev.mainthread;
import java.util.List;
import jakarta.persistence.Column;
import jakarta.persistence.Entity;
import jakarta.persistence.FetchType;
import jakarta.persistence.GeneratedValue;
import jakarta.persistence.GenerationType;
import jakarta.persistence.Id;
import jakarta.persistence.OneToMany;
import jakarta.persistence.SequenceGenerator;
import jakarta.persistence.Table;
@Entity
@Table(name = "author")
public class Author {
@Id
@GeneratedValue(strategy = GenerationType.SEQUENCE, generator = "author_seq")
@SequenceGenerator(name = "author_seq", sequenceName = "author_seq", allocationSize = 50)
public Long id;
@Column(nullable = false)
public String name;
@OneToMany(mappedBy = "author", fetch = FetchType.LAZY)
public List<Book> books;
public Author() {
}
public Author(String name) {
this.name = name;
}
}Hibernate ORM 7 note: The
@GeneratedValue/@SequenceGeneratorpair above is deliberate. Since Hibernate ORM 6, each entity hierarchy gets its own sequence by default with anallocationSizeof 50. Quarkus generates the DDL matching this expectation automatically; there is nohibernate_sequencetable like in Hibernate 5.
Seed Data
Add an import file so Dev Services populates the database on each restart.
src/main/resources/import.sql
INSERT INTO author(id, name) VALUES (1, 'Ursula K. Le Guin');
INSERT INTO author(id, name) VALUES (51, 'Octavia Butler');

INSERT INTO book(id, title, author_id) VALUES (1,  'The Left Hand of Darkness', 1);
INSERT INTO book(id, title, author_id) VALUES (2,  'The Dispossessed',          1);
INSERT INTO book(id, title, author_id) VALUES (51, 'Kindred',                   51);
INSERT INTO book(id, title, author_id) VALUES (52, 'Parable of the Sower',      51);

ALTER SEQUENCE author_seq RESTART WITH 101;
ALTER SEQUENCE book_seq RESTART WITH 101;
The IDs jump to match the allocationSize = 50 pooled-lo optimizer Quarkus uses. If you use IDs 1 and 2 but start the sequence at 3, Hibernate’s next allocation will produce IDs starting at 53, not 3 — your import IDs stay stable across restarts, but programmatic inserts will use IDs from the next pool window.
The REST Resource (with a deliberate N+1)
package dev.mainthread;

import java.util.HashMap;
import java.util.List;
import java.util.Map;

import org.hibernate.SessionFactory;
import org.hibernate.stat.Statistics;

import jakarta.enterprise.context.ApplicationScoped;
import jakarta.inject.Inject;
import jakarta.persistence.EntityManager;
import jakarta.transaction.Transactional;
import jakarta.ws.rs.GET;
import jakarta.ws.rs.POST;
import jakarta.ws.rs.Path;
import jakarta.ws.rs.Produces;
import jakarta.ws.rs.core.MediaType;

@Path("/bookstore")
@ApplicationScoped
@Produces(MediaType.APPLICATION_JSON)
public class BookstoreResource {

    @Inject
    EntityManager em;

    /**
     * N+1 endpoint (deliberately broken) that demonstrates the N+1 problem.
     * <p>
     * Returns a list of authors with their book counts.
     * <p>
     * Loads all authors in one query, then issues one query per author to fetch
     * their books. Classic N+1.
     */

    @GET
    @Path("/authors-with-books-n1")
    @Transactional
    public List<Map<String, Object>> authorsWithBooksN1() {
        // Loads all authors in one query, then issues one query per author
        // to fetch their books. Classic N+1.
        List<Author> authors = em.createQuery("FROM Author a", Author.class)
                .getResultList();

        return authors.stream().map(a -> {
            Map<String, Object> m = new HashMap<>();
            m.put("author", a.name);
            m.put("bookCount", a.books.size()); // <-- triggers lazy load per author
            return m;
        }).toList();
    }

    /**
     * Fixed endpoint (JOIN FETCH) that fixes the N+1 problem.
     * <p>
     * Returns a list of authors with their book counts.
     * <p>
     * Uses a JOIN FETCH to load the books in a single query, avoiding the N+1
     * problem.
     */

    @GET
    @Path("/authors-with-books")
    @Transactional
    public List<Map<String, Object>> authorsWithBooks() {
        List<Author> authors = em.createQuery(
                "SELECT DISTINCT a FROM Author a JOIN FETCH a.books", Author.class)
                .getResultList();

        return authors.stream().map(a -> {
            Map<String, Object> m = new HashMap<>();
            m.put("author", a.name);
            m.put("bookCount", a.books.size());
            return m;
        }).toList();
    }

    private Statistics stats() {
        return em.getEntityManagerFactory()
                .unwrap(SessionFactory.class)
                .getStatistics();
    }

    @GET
    @Path("/stats")
    public Map<String, Object> statsEndpoint() {
        Statistics s = stats();
        return Map.of(
                "queriesExecuted", s.getQueryExecutionCount(),
                "entitiesLoaded", s.getEntityLoadCount(),
                "collectionsFetched", s.getCollectionFetchCount(),
                "preparedStatements", s.getPrepareStatementCount(),
                "slowestQuery", s.getQueryExecutionMaxTimeQueryString() != null
                        ? s.getQueryExecutionMaxTimeQueryString()
                        : "none recorded",
                "slowestQueryMs", s.getQueryExecutionMaxTime());
    }

    @POST
    @Path("/stats/reset")
    public void resetStats() {
        stats().clear();
    }
}
Enabling Statistics in application.properties
src/main/resources/application.properties
# src/main/resources/application.properties

# DataSource – Dev Services will spin up a PostgreSQL container automatically
# when no URL is configured. Nothing else needed for local development.
quarkus.datasource.db-kind=postgresql

# Schema management
quarkus.hibernate-orm.schema-management.strategy=drop-and-create

# Disable batch collection loading so the N+1 is clearly visible in stats.
# Quarkus defaults this to 16, which partially masks N+1 problems.
quarkus.hibernate-orm.fetch.batch-size=-1

# Hibernate Statistics
# Enable the statistics mechanism so counters are collected.
quarkus.hibernate-orm.statistics=true

# Expose collected stats as Prometheus metrics on /q/metrics.
# Requires quarkus-micrometer-registry-prometheus on the classpath.
quarkus.hibernate-orm.metrics.enabled=true

# Logging
# Print a per-session summary in the log after each EntityManager is closed.
# Requires statistics=true above. Quarkus defaults log-session-metrics to false.
quarkus.hibernate-orm.log-session-metrics=true
# In Hibernate ORM 7+ the logger moved to org.hibernate.session.metrics at DEBUG level.
quarkus.log.category."org.hibernate.session.metrics".level=DEBUG

# Optional: see the SQL being executed so you can correlate it with the stats.
quarkus.hibernate-orm.log.sql=true
quarkus.hibernate-orm.log.format-sql=true
quarkus.hibernate-orm.statisticsvshibernate.generate_statistics: In Quarkus you should use the Quarkus config key. Setting the raw Hibernate property inapplication.propertiesstill works, but it bypasses Quarkus’s build-time optimisation path and meansquarkus.hibernate-orm.metrics.enabledwill not automatically activate statistics for you.
A subtle gotcha: if quarkus.hibernate-orm.metrics.enabled=true, Quarkus forces statistics=true at build time regardless of what you set. The reverse is not true — setting statistics=true without metrics.enabled gives you the API and log output but no Prometheus exposure.
Running the Application
quarkus devQuarkus Dev Services pulls a PostgreSQL container automatically. The schema is dropped and recreated, the import script runs, and you’re live.
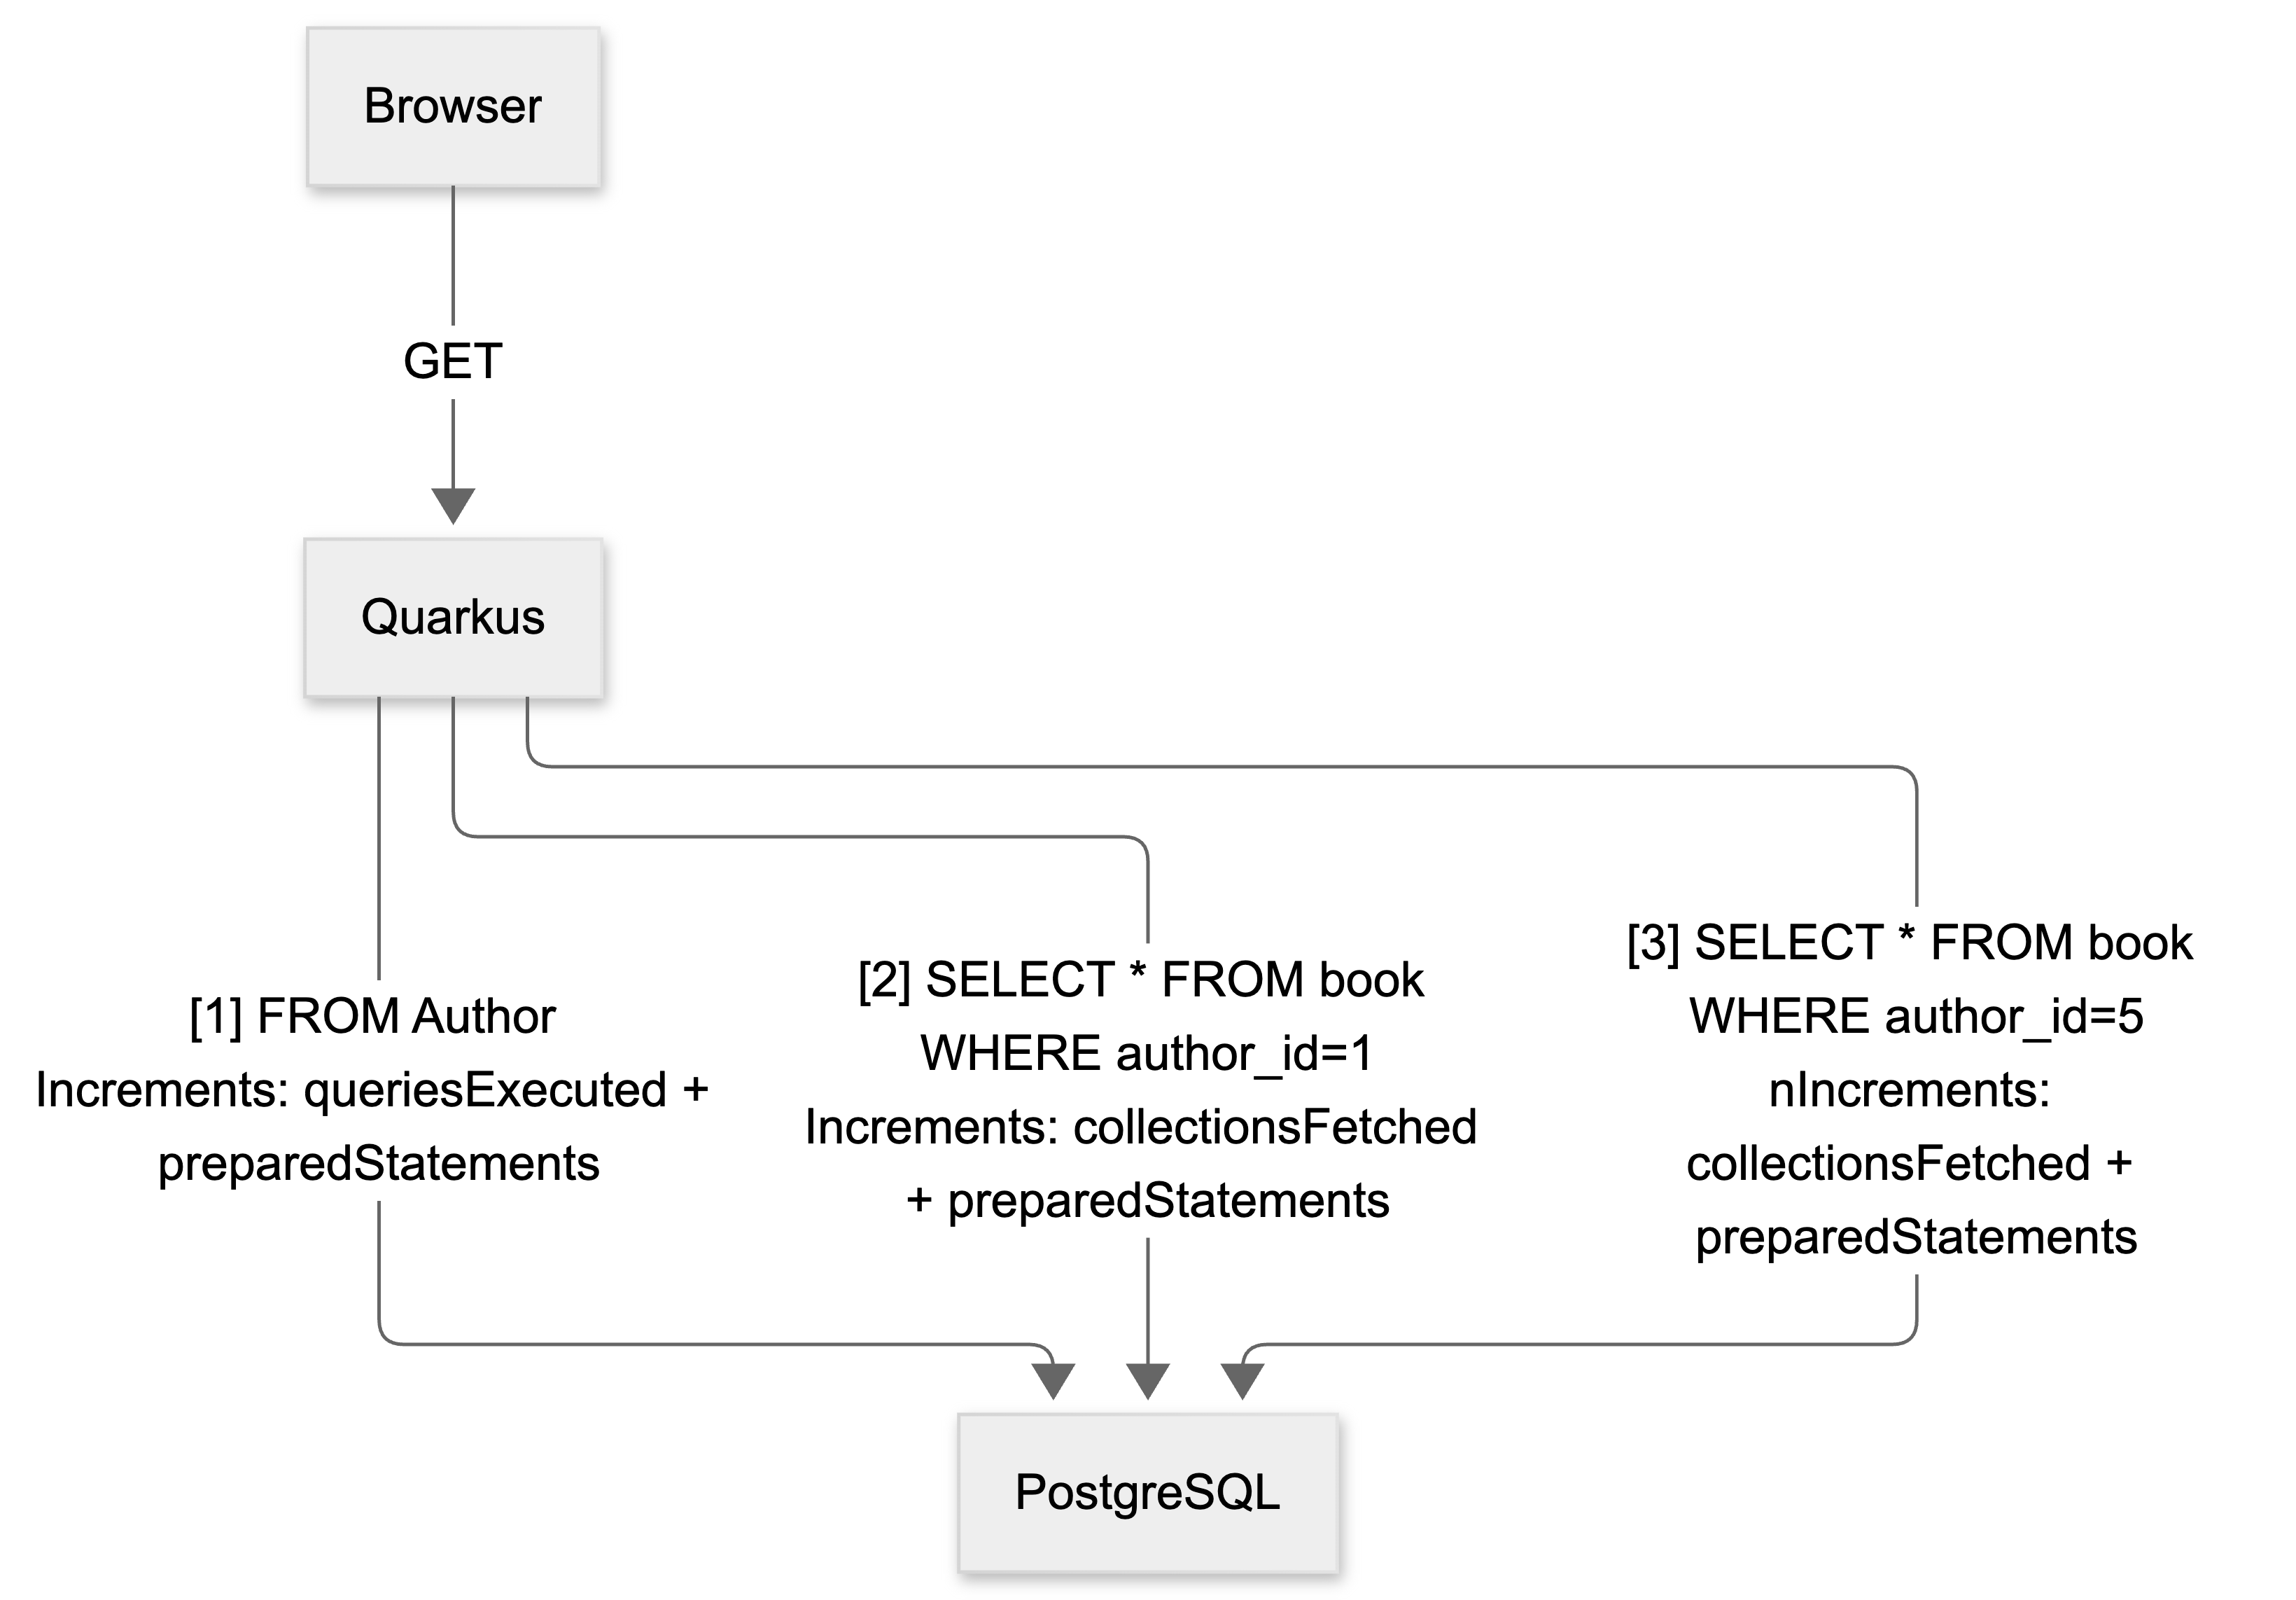
Reproduce the N+1
# Reset baseline
curl -s -X POST http://localhost:8080/bookstore/stats/reset

# Hit the broken endpoint
curl -s http://localhost:8080/bookstore/authors-with-books-n1 | jq .

# Check the stats
curl -s http://localhost:8080/bookstore/stats | jq .
The stats endpoint will report something like:
{
  "entitiesLoaded": 6,
  "slowestQuery": "FROM Author a",
  "collectionsFetched": 2,
  "queriesExecuted": 1,
  "preparedStatements": 3,
  "slowestQueryMs": 19
}
Three prepared statements for two authors: That is the N+1. But notice queriesExecuted is only 1. This is the first subtlety of the Statistics API: getQueryExecutionCount() only tracks HQL/JPQL/Criteria queries. Lazy collection loads do not go through the query executor; they produce JDBC prepared statements and increment getCollectionFetchCount() instead. To see the real number of database round trips, look at preparedStatements (which wraps getPrepareStatementCount()): 1 for the initial author query + 1 per author’s lazy-loaded book collection = 3 total. And collectionsFetched: 2 is the specific N+1 signal. One extra fetch per author.
Now check the log. After each request you’ll see a session summary at DEBUG level:
DEBUG [org.hib.ses.metrics] HHH000401: Logging session metrics:
    ... ns preparing 3 JDBC statements
    ... ns executing 3 JDBC statements
    0 ns executing 0 JDBC batches
    ...
    ... ns executing 1 flushes (flushing a total of 6 entities and 2 collections)
The session log counts JDBC statements, not HQL queries. You can see 3 statements here — exactly matching preparedStatements from the stats endpoint. This is the number you want to minimize.
Here is what is happening under the hood:
queriesExecuted sees 1. preparedStatements sees 3. collectionsFetched sees 2. The last two are the N+1 signal.
Fix It
curl -s -X POST http://localhost:8080/bookstore/stats/reset
curl -s http://localhost:8080/bookstore/authors-with-books | jq .
curl -s http://localhost:8080/bookstore/stats | jq .
{
"entitiesLoaded": 6,
"slowestQuery": "none recorded",
"collectionsFetched": 0,
"queriesExecuted": 1,
"preparedStatements": 1,
"slowestQueryMs": 0
}One prepared statement. Zero collection fetches. The JOIN FETCH collapsed what was three database round trips into one. Here is the side-by-side comparison:
queriesExecuted:N+1 endpoint: 1
JOIN FETCH endpoint: 1
collectionsFetched:N+1 endpoint: 2
JOIN FETCH endpoint: 0
preparedStatements:N+1 endpoint: 3
JOIN FETCH endpoint: 1
The first row is identical: queriesExecuted is a misleading signal for N+1 detection. The second and third rows are the ones that matter.
A note on
quarkus.hibernate-orm.fetch.batch-size: We setbatch-size=-1above to disable batch collection loading and make the N+1 clearly visible. Quarkus defaults this to 16, which means Hibernate will batch-load up to 16 uninitialized collections of the same type in a single query when you touch any one of them. With only 2 authors, batch fetching reduces the 3 statements to 2 and the collection fetches from 2 to 1 — a partial mitigation that can mask the problem in small data sets.JOIN FETCHis still the proper fix because it eliminates the extra round trip entirely. In production, leave the default batch-size at 16 as a safety net; it limits the blast radius of any N+1 that slips past your tests.Alternative:
@EntityGraph. If you prefer annotation-based control, JPA’s@EntityGraphachieves the same eager loading without modifying the query string. It is especially useful in Spring Data–style repositories where you don’t write HQL directly.Watch out for multiple collections.
JOIN FETCHon a single@OneToManyis clean, butJOIN FETCH a.books JOIN FETCH a.awardson two collections produces a Cartesian product — the result set is|books| × |awards|rows per author. For multiple collections, use separate queries or@EntityGraphwithtype = LOAD.
The Prometheus Metrics Endpoint
Because we added quarkus-micrometer-registry-prometheus and set quarkus.hibernate-orm.metrics.enabled=true, Hibernate statistics are exported as standard Prometheus gauges and counters at /q/metrics.
curl -s http://localhost:8080/q/metrics | grep hibernateYou’ll see a block like:
# HELP hibernate_queries_executed_total Total number of executed queries
# TYPE hibernate_queries_executed_total counter
hibernate_queries_executed_total{entityManagerFactory="<default>",} 2.0

# HELP hibernate_entities_loaded_total
# TYPE hibernate_entities_loaded_total counter
hibernate_entities_loaded_total{entityManagerFactory="<default>",} 12.0

# HELP hibernate_collection_fetches_total
# TYPE hibernate_collection_fetches_total counter
hibernate_collection_fetches_total{entityManagerFactory="<default>",} 2.0

# HELP hibernate_query_execution_max_time_seconds
# TYPE hibernate_query_execution_max_time_seconds gauge
hibernate_query_execution_max_time_seconds{entityManagerFactory="<default>",} 0.042

# HELP hibernate_prepare_statement_total
# TYPE hibernate_prepare_statement_total counter
hibernate_prepare_statement_total{entityManagerFactory="<default>",} 4.0
Every metric carries the entityManagerFactory label. If you have multiple persistence units (a Quarkus 3.22+ feature), each one gets its own label value so you can filter in Prometheus or Grafana without ambiguity.
A Metric That Actually Matters: collection_fetches
hibernate_collection_fetches_total is the canary. In a healthy application it should be zero or very close to it in production traffic. A collection fetch is always a lazy load that Hibernate had to execute against the database. If this counter grows alongside your request rate, you have an N+1 that slipped through.
Other metrics worth dashboarding:
MetricWhat it tells youhibernate_prepare_statement_totalTotal JDBC round trips (the real workload indicator)hibernate_queries_executed_totalHQL/JPQL query volume (does not include lazy loads)hibernate_query_execution_max_time_secondsWorst-case query timehibernate_entities_loaded_totalEntity hydration pressurehibernate_second_level_cache_hit_countL2C hits (compute ratio with _miss_count in PromQL)hibernate_optimistic_failure_totalOptimistic lock contention
Writing a Test That Asserts Query Counts
The most valuable thing you can do with statistics is assert them in tests. This gives you a regression gate: if someone adds a lazy association and accidentally reintroduces an N+1, the test fails before the PR merges.
Also make sure to add the following dependency to the pom.xml:
        <dependency>
            <groupId>org.assertj</groupId>
            <artifactId>assertj-core</artifactId>
            <version>3.27.3</version>
            <scope>test</scope>
        </dependency>
src/test/java/dev/mainthread/QueryCountTest.java
package dev.mainthread;

import static org.assertj.core.api.Assertions.assertThat;

import org.hibernate.SessionFactory;
import org.hibernate.stat.Statistics;
import org.junit.jupiter.api.BeforeEach;
import org.junit.jupiter.api.Test;

import io.quarkus.test.junit.QuarkusTest;
import jakarta.inject.Inject;
import jakarta.persistence.EntityManager;
import jakarta.transaction.Transactional;

@QuarkusTest
class QueryCountTest {

    @Inject
    EntityManager em;

    private Statistics stats() {
        return em.getEntityManagerFactory()
                 .unwrap(SessionFactory.class)
                 .getStatistics();
    }

    @BeforeEach
    void reset() {
        stats().clear();
    }

    @Test
    @Transactional
    void joinFetchIssuesExactlyOneQuery() {
        em.createQuery(
                "SELECT DISTINCT a FROM Author a JOIN FETCH a.books", Author.class)
          .getResultList()
          .forEach(a -> a.books.size()); // force access to collections

        assertThat(stats().getQueryExecutionCount())
            .as("JOIN FETCH should require exactly 1 query")
            .isEqualTo(1);

        assertThat(stats().getCollectionFetchCount())
            .as("No additional collection fetches should occur with JOIN FETCH")
            .isEqualTo(0);
    }

    @Test
    @Transactional
    void lazyLoadingProducesNPlusOneStatements() {
        var authors = em.createQuery("FROM Author a", Author.class)
                        .getResultList();

        authors.forEach(a -> a.books.size());

        long authorCount = authors.size();

        assertThat(stats().getQueryExecutionCount())
            .as("Only the HQL query counts as a 'query executed'")
            .isEqualTo(1);

        assertThat(stats().getPrepareStatementCount())
            .as("N+1: 1 (authors query) + N (one lazy load per author)")
            .isEqualTo(1 + authorCount);

        assertThat(stats().getCollectionFetchCount())
            .as("Each author's collection was fetched separately")
            .isEqualTo(authorCount);
    }
}
Run it:
./mvnw test -Dtest=QueryCountTestBoth tests pass and document the intended behaviour. joinFetchIssuesExactlyOneQuery is your regression gate: if it ever fails, you know a fetch strategy changed.
A Deeper Look at the Statistics API
The org.hibernate.stat.Statistics interface is broad. Here is a map of the most practically useful parts, organised by what question you’re actually trying to answer.
“How many database round trips is this request making?”
Statistics s = sessionFactory.getStatistics();

long queries    = s.getQueryExecutionCount();     // HQL/JPQL/Criteria queries only
long statements = s.getPrepareStatementCount();   // ALL prepared statements
long fetches    = s.getCollectionFetchCount();    // Lazy collection loads specifically
long connects   = s.getConnectCount();            // Connection acquisitions from the pool
getPrepareStatementCount() is the closest thing to “total database round trips.” It is almost always larger than getQueryExecutionCount() because lazy collection loads, entity-level inserts/updates/deletes, and batch operations all produce prepared statements but are not tracked as “queries.” In an N+1 scenario, getQueryExecutionCount() stays at 1 while getPrepareStatementCount() and getCollectionFetchCount() reveal the hidden work.
Try it yourself. Reset stats, hit the N+1 endpoint, and compare queriesExecuted with preparedStatements:
curl -s -X POST http://localhost:8080/bookstore/stats/reset
curl -s http://localhost:8080/bookstore/authors-with-books-n1 > /dev/null
curl -s http://localhost:8080/bookstore/stats | jq '{queriesExecuted, preparedStatements, collectionsFetched}'
“Is my second-level cache working?”
long l2cHits   = s.getSecondLevelCacheHitCount();
long l2cMisses = s.getSecondLevelCacheMissCount();
long l2cPuts   = s.getSecondLevelCachePutCount();

// Effective cache ratio:
long total = l2cHits + l2cMisses;
double hitRatio = total == 0 ? 0.0 : (double) l2cHits / total;
If you’re not using the second-level cache, these will all be zero — which is fine. If you are, and your hit ratio is low, you either have a cold cache or your eviction policy is too aggressive.
“Which query is my bottleneck?”
String slowestHql = s.getQueryExecutionMaxTimeQueryString();
long   slowestMs  = s.getQueryExecutionMaxTime();

// Per-query statistics
QueryStatistics qs = s.getQueryStatistics("SELECT DISTINCT a FROM Author a JOIN FETCH a.books");
long execCount    = qs.getExecutionCount();
long execMaxTime  = qs.getExecutionMaxTime();
double execAvgTime = qs.getExecutionAvgTimeAsDouble();
getQueryStatistics(String) accepts both HQL/JPQL and native SQL query strings.
“Is my entity lifecycle healthy?”
EntityStatistics es = s.getEntityStatistics(Author.class.getName());
long loads    = es.getLoadCount();
long fetches  = es.getFetchCount();   // fetches from DB (not L1/L2 cache)
long inserts  = es.getInsertCount();
long updates  = es.getUpdateCount();
long deletes  = es.getDeleteCount();
A healthy ratio: fetchCount should be much smaller than loadCount in a warm application. If they’re equal, nothing is being served from cache and every load is a database hit.
“Do I have optimistic locking contention?”
long optimisticFailures = s.getOptimisticFailureCount();Any non-zero value here under normal load is worth investigating. Each optimistic failure means a transaction was retried or rejected because two sessions modified the same row concurrently.
The StatisticsImplementor Interface
If you need to do something with the metrics beyond reading them, say, publish them to a custom monitoring system, or increment a business-level counter alongside the ORM counter, you can implement org.hibernate.stat.spi.StatisticsImplementor.
This interface extends Statistics and adds a set of callback methods that Hibernate calls at internal lifecycle points:
void openSession();
void closeSession();
void flush();
void connect();
void prepareStatement();
void loadEntity(String entityName);
void fetchEntity(String entityName);
void insertEntity(String entityName);
void updateEntity(String entityName);
void upsertEntity(String entityName);   // new in ORM 7
void deleteEntity(String entityName);
void queryExecuted(String query, int rows, long time);
void entityCacheHit(NavigableRole entityName, String regionName);
void entityCacheMiss(NavigableRole entityName, String regionName);
// ... and many more
To plug in a custom implementation, provide a StatisticsFactory via the hibernate.stats.factory configuration property. This is an advanced use case — the built-in StatisticsImpl is sufficient for the vast majority of production scenarios. But knowing these callbacks exist means you can, for example, log every entity cache miss with its region name when debugging a specific caching issue, then remove the custom implementation afterwards.
Per-Session Logging in Production
Two properties work together to enable this. quarkus.hibernate-orm.log-session-metrics=true tells Quarkus to register the StatisticalLoggingSessionEventListener on each session. In Hibernate ORM 7+ the listener logs through a new logger category, org.hibernate.session.metrics, at DEBUG level, so we also need quarkus.log.category."org.hibernate.session.metrics".level=DEBUG. With both in place, Quarkus prints a summary each time an EntityManager is closed — which in a REST application is effectively once per request. The log entry looks like this:
DEBUG [org.hib.ses.metrics] HHH000401: Logging session metrics:
    523200 ns acquiring 1 JDBC connections
    48700 ns releasing 1 JDBC connections
    2884100 ns preparing 3 JDBC statements
    891600 ns executing 3 JDBC statements
    0 ns executing 0 JDBC batches
    0 ns performing 0 second-level cache puts
    0 ns performing 0 second-level cache hits
    0 ns performing 0 second-level cache misses
    1247300 ns executing 1 flushes (flushing a total of 6 entities and 2 collections)
    0 ns executing 0 pre-partial-flushes
    0 ns executing 0 partial-flushes (flushing a total of 0 entities and 0 collections)
This is a zero-dependency signal that requires no metrics infrastructure. In a staging environment where you don’t have Prometheus, this log line alone tells you whether a request went to the database once or seven times.
Keep log-session-metrics=true in development and staging. In production, set it to false (the default) unless you’re actively diagnosing a performance regression — the log volume is proportional to request rate, and at scale it will fill your log aggregator.
Hibernate ORM 5/6 vs 7: In older Hibernate the logger was
org.hibernate.engine.internal.StatisticalLoggingSessionEventListenerat INFO level. Hibernate ORM 7 moved it toorg.hibernate.session.metricsat DEBUG level. You need both the Quarkus property (log-session-metrics=trueto register the listener) and the log category (org.hibernate.session.metricsat DEBUG to make it visible).
What to Do With This in Production
The overhead of statistics collection is minimal. Hibernate uses lock-free AtomicLong counters internally, so the cost per statement is a handful of incrementAndGet() calls. In benchmarks this is typically well under 1% of request latency. That said, statistics=false is the default for a reason: if you are not reading the counters, there is no point collecting them.
A few concrete patterns that work well:
Alerting on collection fetches: Set a Prometheus alert on
rate(hibernate_collection_fetches_total[5m]) > 0. A non-zero collection fetch rate in production almost always means an N+1 got past your tests.Slowest query tracking: The
hibernate_query_execution_max_time_secondsgauge does not reset automatically. Callstatistics.clear()periodically (for example from a scheduled task every 24 hours) if you want a rolling window rather than a lifetime maximum.Multiple persistence units: If your application has more than one
@PersistenceUnit, each gets its ownStatisticsinstance and its own Prometheus label. Useem.getEntityManagerFactory().unwrap(SessionFactory.class)inside the correct injection point for each unit.
Summary
Hibernate Statistics is not a debugging-only tool. With a few configuration properties it gives you production-grade observability — Prometheus counters, per-query timing, cache effectiveness ratios, and optimistic lock contention — with zero additional infrastructure. The StatisticalLoggingSessionEventListener log output costs nothing to enable and provides per-session round-trip counts during development. The getCollectionFetchCount() assertion in a @QuarkusTest turns an N+1 from a runtime surprise into a CI failure.
The Vlad Mihalcea article that inspired this one covered the API surface in depth. What Quarkus adds is the configuration bridge (quarkus.hibernate-orm.statistics, quarkus.hibernate-orm.metrics.enabled), the Dev Services integration that means you have a database without any setup, and the Micrometer export that makes the numbers visible in whatever monitoring system you already run.