

Tracing the Mind of Your AI: Java Observability with Quarkus and LangChain4j
Instrument, trace, and monitor your AI-powered Java apps using local LLMs, Ollama, and OpenTelemetry with zero boilerplate


What if your Java backend could not only talk like a poet, but also let you trace every creative neuron it fired to get there?
This hands-on article shows you how to build a fully observable, AI-powered Java application using Quarkus, LangChain4j, and OpenTelemetry. You'll wire in a local LLM served with Ollama, expose an intelligent REST endpoint that generates poems on demand, and light up a Grafana dashboard with distributed tracing and model metrics.
This is more than a “Hello AI” tutorial. We’re instrumenting every prompt, every response, every token.
Prerequisites
Before we begin, ensure you have the following installed:
A Java Development Kit (JDK) 11+
Apache Maven 3.8.x or later
Podman (or Docker for the Dev Services)
Project Setup: The Foundation of Our AI App
First, let's create a new Quarkus project with all the necessary extensions. Open your terminal and run the following command:
mvn io.quarkus.platform:quarkus-maven-plugin:create \
    -DprojectGroupId=org.acme \
    -DprojectArtifactId=quarkus-langchain4j-observability \
    -Dextensions="rest-jackson,langchain4j-ollama,opentelemetry"
cd quarkus-langchain4j-observability
This command scaffolds a new Quarkus project including:
quarkus-rest-jackson: For creating a RESTful endpoint.quarkus-langchain4j-ollama: To integrate with a local Ollama model.quarkus-opentelemetry: For generating and exporting OpenTelemetry traces.
Also make sure to add the lgtm Dev Services to the pom.xml right after project creation:
<dependency>
    <groupId>io.quarkus</groupId>
    <artifactId>quarkus-observability-devservices-lgtm</artifactId>
    <scope>provided</scope>
</dependency>quarkus-observability-devservices-lgtm: A powerful development service that spins up a pre-configured observability stack consisting of Loki (for logs), Grafana (for visualization), Tempo (for traces), and Mimir (for metrics).
The full source code is in my Github repository in case you want to get started quickly.
Configuring the Application
Next, we need to configure our application to communicate with the local Ollama model. Open the src/main/resources/application.properties file and add the following lines:
# Configure the Ollama model
quarkus.langchain4j.ollama.chat-model.model-id=llama3:latest

# Enable tracing for Langchain4j
quarkus.langchain4j.tracing.include-prompt=true
quarkus.langchain4j.tracing.include-completion=true

#Enable Otel logs
quarkus.otel.logs.enabled=true
quarkus.otel.traces.enabled=true
These properties tell our application which Ollama model to use. We also explicitly enable tracing for prompts and completions from Langchain4j interactions.
Creating the AI Service
Now, let's define our AI service. Langchain4j in Quarkus allows us to define an AI service declaratively using an interface. Create a new Java interface named PoemService.java in the org.acme package:
package org.acme;

import dev.langchain4j.service.SystemMessage;
import dev.langchain4j.service.UserMessage;
import io.quarkiverse.langchain4j.RegisterAiService;

@RegisterAiService
public interface PoemService {

    @SystemMessage("You are a professional poet.")
    @UserMessage("Write a short poem about {topic}. The poem should be in the style of {style}.")
    String writePoem(String topic, String style);
}
The @RegisterAiService annotation magically turns this interface into a CDI bean that can be injected anywhere in our application. The @SystemMessage provides a directive to the AI model about its persona, and the @UserMessage defines the template for the user's prompt.
4. Exposing the AI Service via a REST Endpoint
To interact with our PoemService, we'll create a simple REST endpoint. Rename the scaffolded GreetingResource.java into PoemResource.java in the org.acme package and add the following content:
package org.acme;

import jakarta.inject.Inject;
import jakarta.ws.rs.GET;
import jakarta.ws.rs.Path;
import jakarta.ws.rs.Produces;
import jakarta.ws.rs.QueryParam;
import jakarta.ws.rs.core.MediaType;

@Path("/poem")
public class PoemResource {

    @Inject
    PoemService poemService;

    @GET
    @Produces(MediaType.TEXT_PLAIN)
    public String writePoem(@QueryParam("topic") String topic, @QueryParam("style") String style) {
        if (topic == null || topic.isBlank()) {
            topic = "the wonders of programming";
        }
        if (style == null || style.isBlank()) {
            style = "a haiku";
        }
        return poemService.writePoem(topic, style);
    }
}
This class injects our PoemService and exposes a /poem endpoint that accepts topic and style query parameters to generate a poem.
5. Running the Application and Exploring Observability
Now for the exciting part! Make sure your local Ollama instance is running. Then, start the Quarkus application in development mode:
./mvnw quarkus:devWhen the application starts, you'll see output indicating that the LGTM dev service has started containers for Grafana, Tempo, and Loki. You'll also be provided with a URL for the Grafana dashboard, typically
http://localhost:45435/
Open your browser and navigate to the provided Grafana URL. You can log in with the default credentials: username: admin, password: admin. But you don’t have to for this tutorial.
Now, let's generate some traces. In your terminal, use curl or your browser to access the REST endpoint:
curl "http://localhost:8080/poem?topic=Quarkus&style=acrostic"You received a creative limerick about Quarkus!
Q - Questing for innovation's spark
U - Unifying Java and native code in the dark
A - Agile frameworks merge, a new path to take
R - Rethinking integration, no longer at stake
K - Keeping complexity at bay with ease
U - Unlocking performance, as speed increases
S - Sophisticated solutions for modern needs
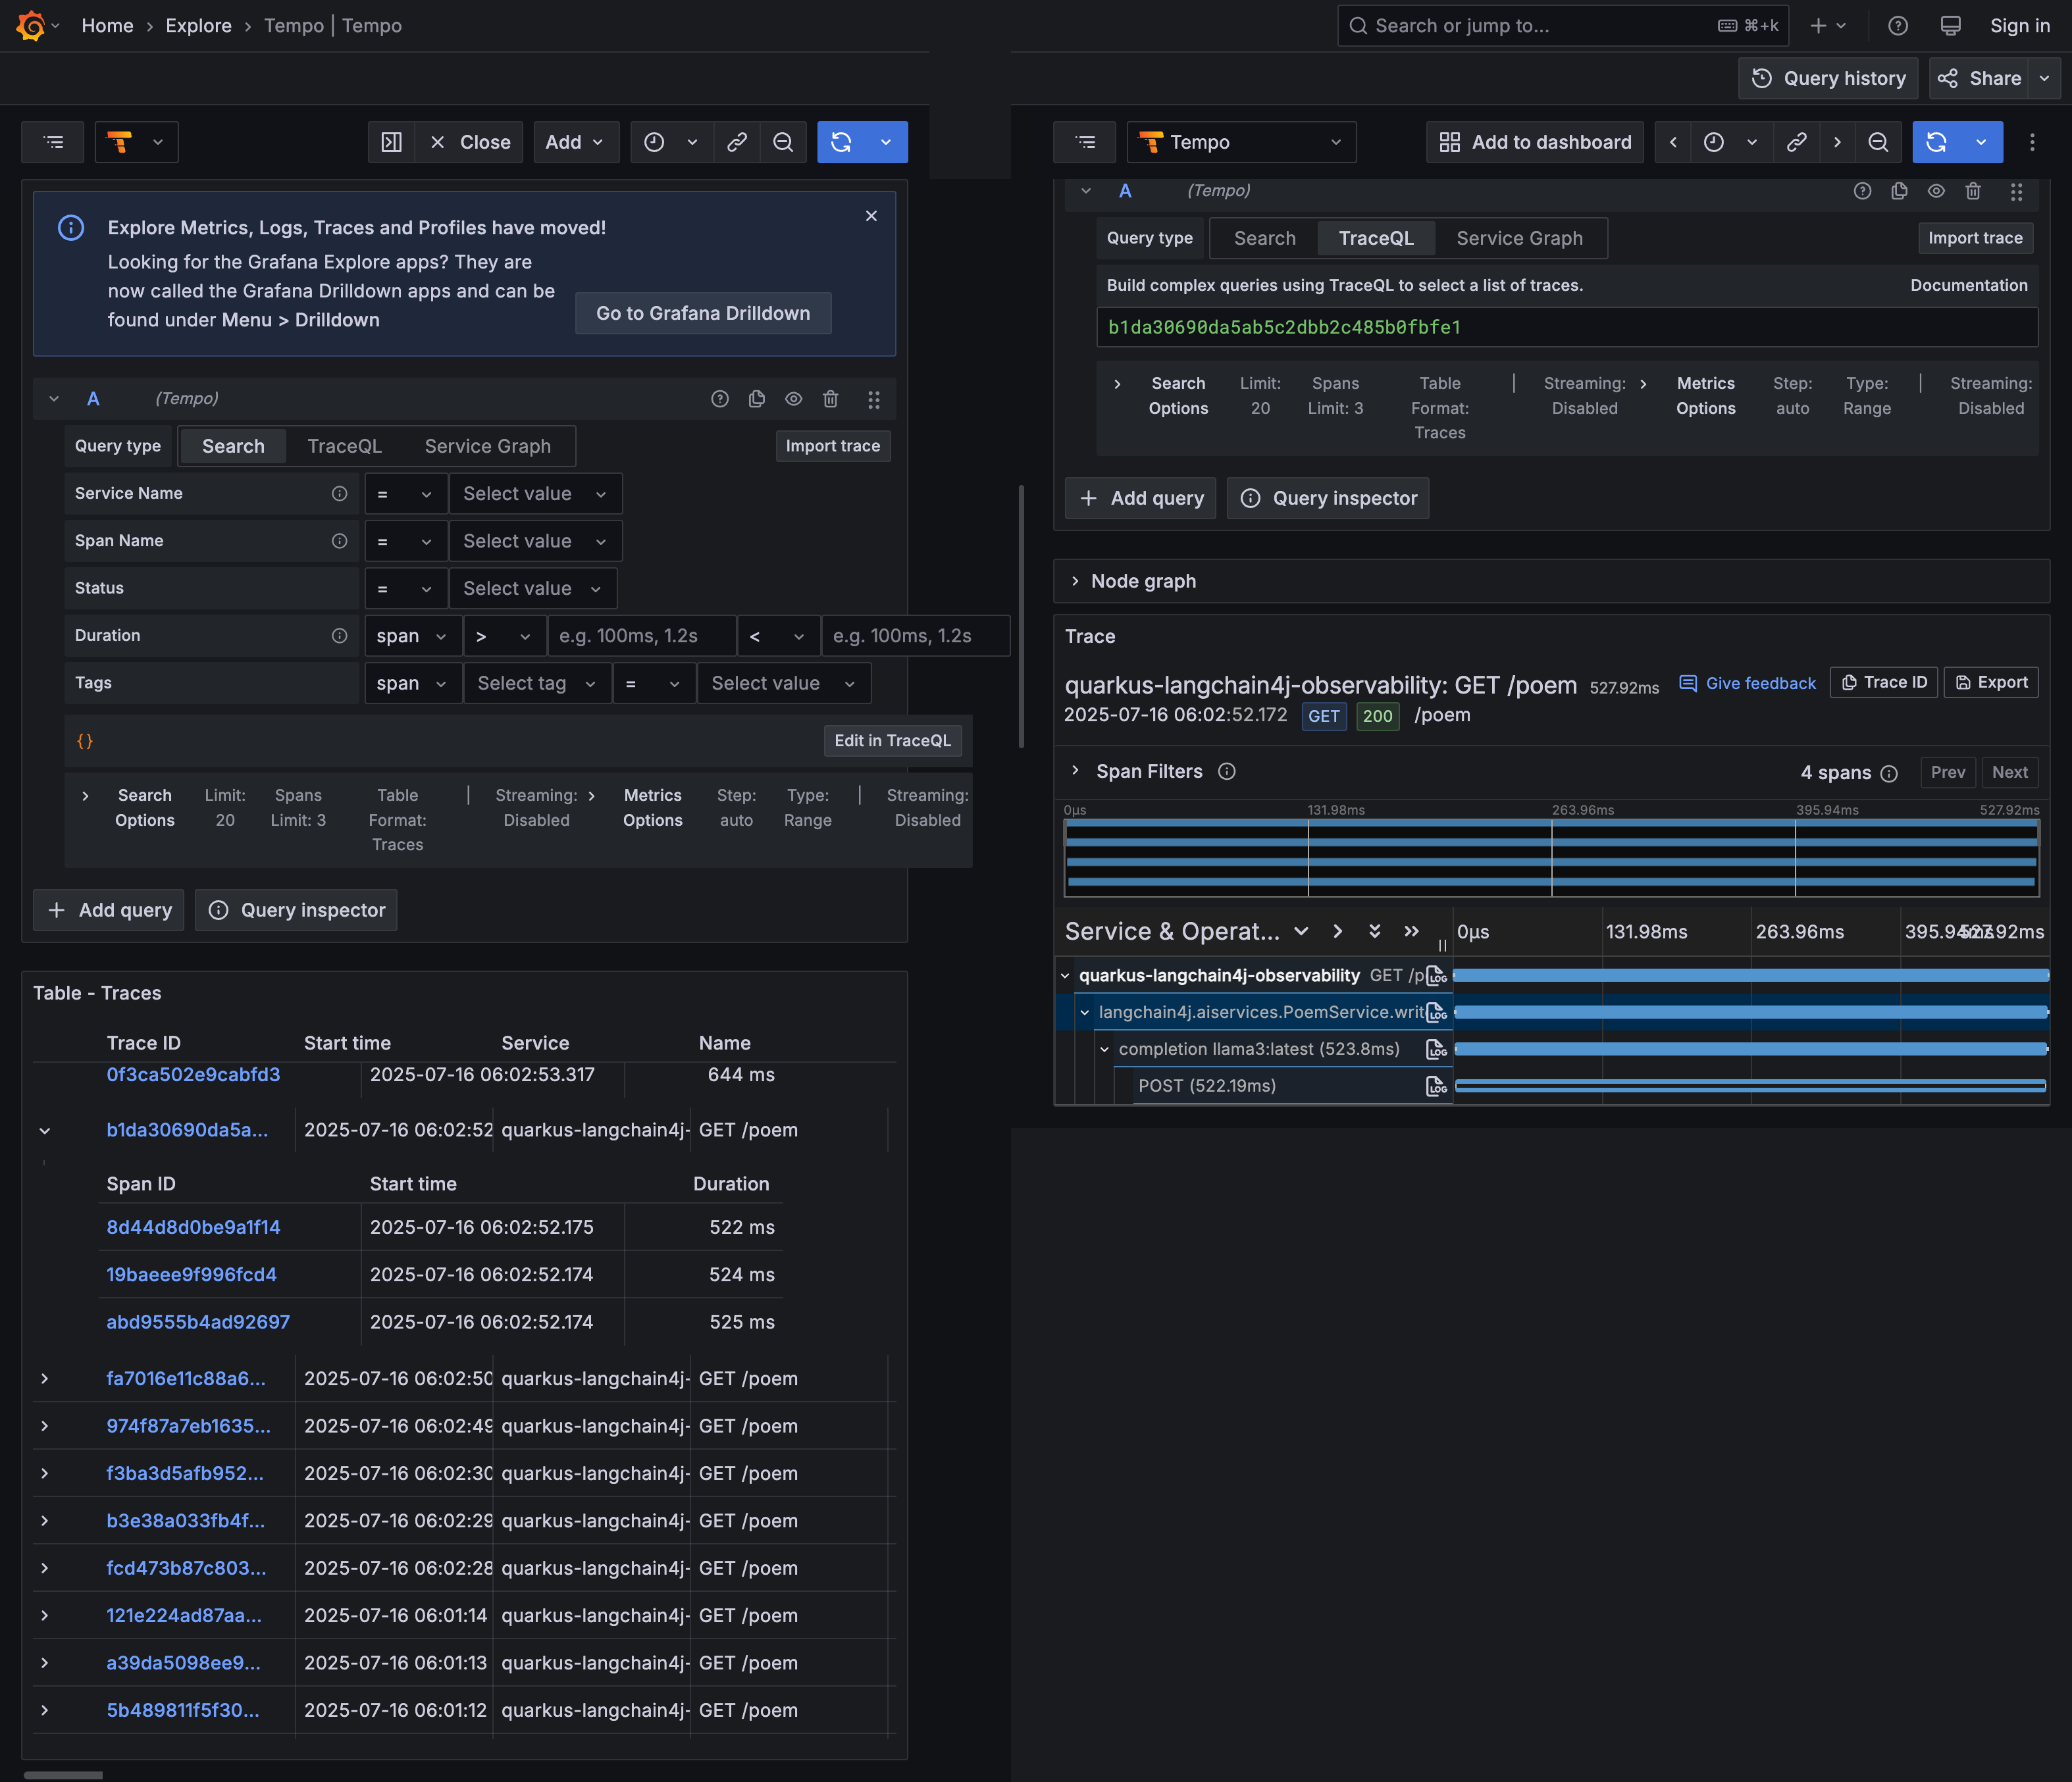
Langchain4j OpenTelemetry Traces
With the quarkus-opentelemetry extension, every interaction with our PoemService generates a trace. These traces provide a detailed, end-to-end view of the request flow, including the call to the AI model.
To view the traces:
In the Grafana UI, go to the Explore view.
From the data source dropdown at the top left, select Tempo.
In the "Search" tab, you should see recent traces. Look for a trace related to the
/poemendpoint.
Each trace is composed of spans. For our application, you'll typically see:
A span for the HTTP request to
/poem.A child span for the execution of the
PoemService.writePoemmethod.Within that, a span representing the call to the Ollama chat model.
Clicking on a span will reveal valuable information in the details panel, including:
gen.ai.system: The AI system used (e.g.,ollama).gen.ai.request.model: The specific model that was called (e.g.,llama3).gen.ai.prompt: The full prompt sent to the model.gen.ai.completion: The response received from the model.
These traces are invaluable for debugging and understanding the behavior of your AI-powered features.
Langchain4j Model Metrics
In addition to traces, the integration of Langchain4j with quarkus-micrometer (which is automatically included with the observability extension) provides insightful metrics about your AI service's performance.
To explore these metrics:
In the Grafana UI, go to the Explore view.
Select the Prometheus data source.
In the "Metrics" browser, you can search for metrics starting with
langchain4j.
Here are some of the key metrics available:
langchain4j_aiservices_counted_totallangchain4j_aiservices_timed_milliseconds_bucketlangchain4j_aiservices_timed_milliseconds_count,..._sum
By combining these metrics, you can create powerful dashboards in Grafana to monitor the health, performance, and cost of your AI services in real-time. Learn more about Observability in the Quarkus LangChain4j documentation.
This tutorial has provided a glimpse into the seamless integration of Quarkus, Langchain4j, and OpenTelemetry. By using these powerful tools, you can build robust, observable, and high-performing AI applications with ease. Happy coding!