


Tokenmaxxing was easy to see as a bad metric. Tokens show how much AI a company used. That matters for cost, but it says little about the result.
Valuemaxxing sounds better because it asks us to measure outcomes. It is also harder to question. Who wants to argue against value?
Adam McDaniel and I made the case for this change in Tokenmaxxing is dead, long live valuemaxxing. I still believe the direction is right. But “value” is a broad word. It is not yet a clear way to measure AI.
A completed task can be called value. So can a saved hour, a closed security issue or a generated migration. Those numbers can all look good while the team deals with more review, more fixes and more software to maintain.
The main mistake behind tokenmaxxing was the hope that one number could explain a complex system. Changing the name of that number to “value” does not solve the problem.
In Burning AI Coins Won’t Transform Your SDLC, I argued that AI activity was never the real unit of work. Now outcome labels can fail in the same way. We still need to know what caused the result, what it cost and whether the result was real.
The dashboard shows where to look
AI dashboards now separate adoption, active users, generated code, budget use and repository activity. That data answers three practical questions: Are people using the tool? Where is it contributing? What does that use cost?
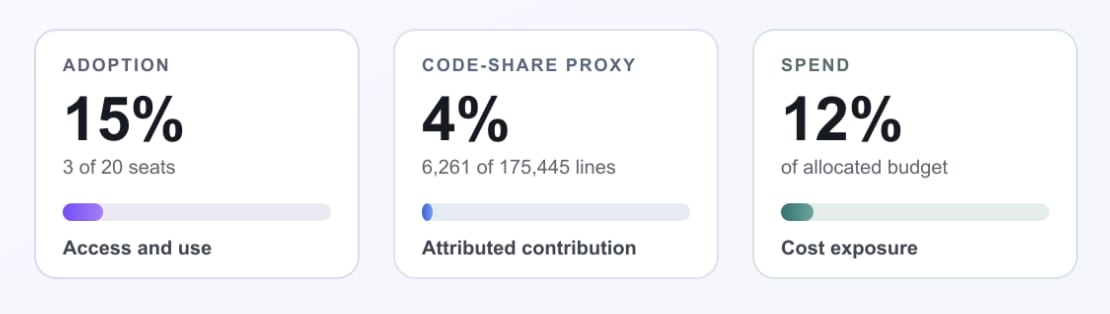
An anonymized 30-day IBM Bob analytics view, rebuilt from the total numbers only. This comes from a test-account, so don’t interpret too much into the numbers shown. Adoption, contribution and spend give a team a clear place to start its value analysis.
The adoption rate shows how far a rollout has reached. In this example, three of twenty seats were active. That may mean the rollout is still early. It may point to weak onboarding or use cases that do not fit the team. It may also show that a small group found one strong workflow. The dashboard narrows the possibilities and gives a leader clear questions to ask.
The code-share number shows where Bob contributes code. Looking at it by team and repository can reveal whether use is broad or concentrated. In this snapshot, the 4% workspace average hides a very uneven pattern. A few small repositories have high AI-attributed shares, while large repositories have almost none. That gives the team a short list of workflows to study. It may also show that AI fits some types of work better than others.
The team and user views can reveal the same pattern at a smaller level. If one person produces most of the AI-attributed code in a repository, the team may have found an internal expert who can help others. It may also have too much knowledge concentrated in one person. Both findings are worth acting on.
Spend adds the cost side. A team can watch whether spend rises with adoption, stays concentrated in one workflow or changes as people learn how to use the tool. Cost per active user and cost per workflow help teams control the rollout and find expensive areas that need a closer look. Delivery results then show whether that cost created value.
The supporting metrics add more context. Usage levels show whether people use Bob daily, often, sometimes or not at all. Daily active-user trends show whether early trials become regular work. Team and repository views show where generated code lands. These signals help a leader decide where to improve onboarding, where to study a workflow and where to change a budget.
Bobalytics provides the first part of the value picture: use, contribution, concentration and cost. Delivery data provides the next part: review time, deployment, rework, incidents and customer results. Connecting both sets of data is how a team moves from an AI usage dashboard to real unit economics.
That makes the dashboard a map for the investigation. It shows where AI use is real, where it is concentrated and what cost is attached. The team can then verify what changed in those areas.
Value comes from the whole system
Software teams care about several things at the same time: speed, quality, cost, risk, learning, easy future changes and customer results. Every real change has to balance them.
An agent can improve one part and make another part worse:
Ten tickets close, but three reopen after integration testing.
A developer saves four hours, but reviewers spend six hours trying to understand a large generated change.
A modernization project creates 40,000 lines of Java, but the old system stays because the migration was never finished.
A security scanner reports one less issue, but the fix creates a new production risk.
More code enters the repository, so the company has more code to review, secure and maintain.
Each small metric can move in the right direction while the delivery system becomes more expensive.
The 2025 DORA report describes AI as an amplifier. In plain words, AI increases the effect of the system around it. That includes the good parts and the bad parts. A good delivery system may move faster. Weak feedback, poor platforms and unclear ownership may also cause problems faster.
This is why value needs several measures. One score may fit well on a management slide, but engineering teams still need to see the parts below it. If they see only the score, they will learn how to increase the score.
Cost arrives now. Value arrives later
The AI invoice has a date. Model use, platform fees and seats appear in the current billing period.
Many results take longer to appear. A change may save coding time today and add review work tomorrow. The cost of future maintenance appears over several changes. Reliability becomes clear during an incident. Customer results may need weeks of product data. We see learning only when the team solves the next similar problem.
This time gap makes reporting difficult. We compare this month’s cost with this month’s output. Later problems then appear in a different report, often owned by a different team.
We need a set period for each result. It tells us how long we watch the result and which later costs still belong to it.
For example, a dependency upgrade is not complete when an agent opens a pull request. Count it after the change reaches production, passes the checks, stays in place for a set time and does not add review or operations work.
Thirty days will not fit every workflow. A documentation change may need less time. A database migration may need more. Set the period before you read the result. That stops every success from being counted today while every failure is moved into next month.
Value needs a fair comparison
Cost is usually easy to trace. We can see which team, workflow or account used a model.
Value asks a harder question: what would have happened without the AI?
Teams rarely have a clean answer because the work changes when AI becomes available. Developers choose different tasks. They may run several agents while doing other work. They may add tests or documentation that they would have skipped. A task that once looked too expensive may now become possible. A simple time comparison can mix all these changes together.
METR’s early-2025 study shows how large the gap can be. The researchers randomly assigned tasks with or without AI. Sixteen experienced open-source developers worked on real issues in repositories they knew well. Tasks with AI took 19% longer. Before the study, the developers expected AI to make them 24% faster. After the work, they still believed AI had made them 20% faster.
This result covers one group, one period and the tools available in early 2025. It does not prove that AI makes all developers slower.
The February 2026 update adds more reasons. METR saw signs that newer tools helped developers move faster. But many developers no longer wanted to work without AI. Some kept tasks out of the study because they strongly preferred AI for those tasks. Running several agents at once also made time tracking harder. METR decided that the new study could not give a reliable speed number and started changing the study design.
There are two lessons here. People can feel faster while the measured work takes longer. And the method used to measure speed can stop working when AI changes how people choose and do tasks.
A serious AI value program needs a starting point for comparison. It might be past performance before AI, a similar group without AI, an A/B test or a rollout that starts with only some teams. A careful manual estimate can also help when it is clearly marked as an estimate and checked again later.
Saved time has to go somewhere
“Hours saved” is an attractive AI metric because it is easy to turn into money. It is also easy to make this number too large.
A saved hour creates room for other work. The business gains value only when we know what happened next.
The developer might deliver another customer change, reduce a review queue, improve tests or remove a slow manual step. Good. But the hour may also disappear into checking generated code, waiting for CI, answering repeated platform questions or fixing a bad agent run. The first task still looks faster, but the company did not gain the hour.
The work can also move between people. A developer feels the speed gain. Review, security, platform and operations teams may receive more work. The local productivity number can be correct while the company result is poor.
We need the fully loaded cost. This means every cost connected to the result, including human work outside the team that started it. For an AI-assisted software change, count:
model, platform and tool cost;
developer time for prompts, guidance and corrections;
review, test and integration work;
security and compliance checks;
operations work after release;
fixes, rollbacks and reopened work during the measurement period.
This is normal accounting applied to an AI workflow. It will make some savings claims smaller. That is fine. A smaller number we can explain is better than a large number we cannot defend.
Measure the cost of a verified result
The FinOps Foundation calls this unit economics. The idea is simple: connect what you spend with one unit of result.
Early AI programs often start with cost per token. They may then move to cost per assist, agent action or support case avoided. Programs with more experience add all related costs and keep each metric inside a clear type of work. They do not compare unrelated workflows as if they create value in the same way.
For software engineering, I would use AI cost per verified result.
Define six things for each workflow:
Starting point — What happened before AI, or in a similar path without AI?
Result — Which event has real business or engineering meaning?
Full cost — Which human and technical costs belong to the result?
Quality and risk checks — Which numbers would show a cheap but harmful result?
Measurement period — How long must the result stay valid?
Stop rule — When will the team stop or redesign the workflow?
For a dependency-upgrade agent, I would use this:
Cost per dependency upgrade that reaches production, passes the required checks, stays in place for 30 days and does not add review or operations work.
This definition does not count a pull request as a finished upgrade. It also gives the team clear ways to improve the workflow. Smaller changes may reduce review time. Better repository instructions may reduce retries. A validation skill may stop a common bug. A cheaper model may handle routine upgrades after the workflow becomes stable.
The result definition connects the cost to work that passed through the full delivery system.
Compare workflows, not teams
AI workflows create value in different ways.
Routine dependency updates repeat often. They may have a clear starting point and strong automated checks. This makes them a good fit for cost-per-result measures.
Architecture work, incident response and complex modernization are less predictable. Their value may come from better choices, faster learning or lower risk. They need a different way to measure value.
Review each workflow against its own past results, quality limits and cost trend. One workflow may need the best and most expensive model because mistakes cost a lot. Another may use a smaller model after the team improves its instructions and checks. A third may stay mostly human because checking the AI output costs more than the expected gain.
A leaderboard pushes all these workflows toward the same score. Teams then optimize for the score, even when it makes the real work worse.
Every metric needs an owner and regular review. It may help for six months and then become easy to game. When that happens, change it or stop using it.
Stop maxxing. Start accounting.
Valuemaxxing is a good change in direction because it moves attention from AI use to results. It is still missing the rules needed for real measurement.
Each workflow needs a clear result, a full cost, quality and risk checks, a fair starting point and enough time to see what happened. The team should also know when it will stop or redesign the workflow.
AI value will appear across many verified results. One company-wide score will hide too much.
The next question is simple: What reached production, stayed correct and made the next run better? Then ask what the whole system paid to get it there.