


I like demos that have something visual at the end when they finish. For this project, we take the GitHub contribution calendar and turn its weeks into buildings, with windows showing the activity during each week. The result is an SVG that you can add to your profile README and update with a scheduled GitHub Action.
The idea comes from Pink Pixel’s skyline. I kept the weeks-as-buildings approach for this independent Java implementation and used Quarkus GitHub Action to run it. The calendar is turned into a city by a few plain Java classes, which you can run locally with the included sample data. Once you are happy with the image, you can connect the action to your own account and let a workflow publish it.
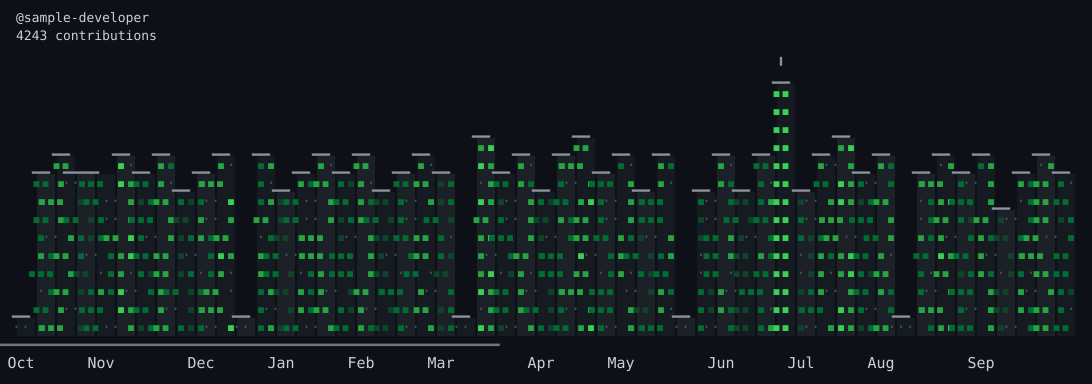
The sample includes quiet weeks and one deliberaty active week. This gives us something to use as test when designing building heights and spacing. The same calendar can be rendered again after each change, so you can see how a layout choice affects the whole city.
Open the project and generate the samples
Start with the companion project, which includes the application, Maven Wrapper, example workflows, and test data. You need JDK 21 to compile and run the Java code. Install JBang as well, because the tests use it to launch the packaged action in the same way as the workflow. Git and Bash are used to check the publisher against a temporary repository. With these tools on your path, run this from the quarkus-contribution-city directory:
./mvnw verifyThe project uses Quarkus 3.33.1 and Quarkus GitHub Action 2.10.0, with JUnit 6.0.3 supplied by the Quarkus platform. The build runs 56 tests and creates six SVG samples in target/previews/. Saved responses and a local test server provide the calendar data, so you can run this step without GitHub credentials.
Open github-dark.svg in your browser, then compare it with recent-12.svg. Both use the same calendar, but the second image shows its most recent twelve weeks. Keep these two images open as you read through the layout code. You can also open mono.svg to see the second theme and empty.svg to see how a year with zero contributions is drawn.
If you want to start a separate application, the Quarkus GitHub Action codestart creates the initial project:
quarkus create app \
  -x quarkus-github-action \
  com.themainthread:quarkus-contribution-city:1.0-SNAPSHOT \
  --name="Quarkus Contribution City" \
  --description="Render a GitHub contribution calendar as an ASCII city" \
  --data=quarkiverse-github-action-codestart.github-repository=myfear/quarkus-contribution-city
This gives you the Quarkus application and action setup. You then add the calendar client, layout, and renderer described below. As this is more a walkthrough, I encourage you to continue in the companion project.
Read the contribution calendar
Open GitHubContributionClient and look at the query. GitHub already groups the contribution data into weeks and days, with a count and contribution level for each day. We can ask for that calendar in one request:
query($login: String!) {
  user(login: $login) {
    contributionsCollection {
      contributionCalendar {
        totalContributions
        weeks {
          firstDay
          contributionDays {
            date
            contributionCount
            contributionLevel
          }
        }
      }
    }
  }
}
The count will be used to calculate building height, and the contribution level will give each window its color. We also request the dates, because month labels need to follow the weeks shown in the image. The username is passed as a GraphQL variable when the query is executed:
response = client.executeSync(QUERY, Map.of("login", username));Before reading the returned calendar, check the response for GraphQL errors. GitHub can return a successful HTTP status together with an error in the response body, for example when the user cannot be found. The client stops with an error at this point. An empty city is reserved for a valid calendar with zero contributions, so a failed request remains visible as a failed action.
We also need to decide when the client is created. In Quarkus GitHub Action 2.10.0, an injected DynamicGraphQLClient sends a rateLimit query during initialization, before the action method starts. That would add a request to every invocation, including one with invalid inputs. To keep our action to a single request, the inputs are checked first and the authenticated client is then created in the adapter’s fetch method:
try (DynamicGraphQLClient client = DynamicGraphQLClientBuilder.newBuilder()
        .url(endpoint).header("Authorization", "Bearer " + token).build()) {
    return fetch(client, username);
}
The action gets the endpoint from GitHub’s Context and passes it to the adapter with the token and username. The inner fetch method sends the query and checks the response, and the client is closed when the block finishes. Errors during client initialization and closing are handled by the enclosing method. You can find more about this setup in the SmallRye dynamic client documentation.
Turn the response into a scene
Follow the response into GitHubContributionParser. Here, the JSON is converted into ContributionDay, ContributionWeek, and ContributionCalendar records with immutable lists. Counts must be nonnegative, days within a week must be consecutive, and weeks must follow one another from oldest to newest. An unknown contribution level also causes an error. These checks give the layout code a calendar with a known order and shape.
From that point, we use ordinary Java objects:
ContributionCalendar → CityBuilder → Scene → SvgRenderer → SVG stringOpen CityBuilder next. It takes the calendar and creates a grid containing the sky, buildings, street, and labels. Each cell describes a character and its role, such as a window or roof, together with the window intensity and building shade. By the time the scene reaches SvgRenderer, all the positions have been chosen. The renderer turns those cells into SVG elements, and the action saves the returned string as contribution-city.svg.
Quarkus connects CityBuilder and SvgRenderer through producers in the action package. Both classes can also be created directly in a test, as you can see in PreviewTest. This is how we generate the sample images locally. You can change a layout rule and render the same calendar again while keeping the GitHub request and file publication separate.
Give each week enough space
For the width, start with a fixed rule: each week gets two text cells. A year with 53 weeks therefore uses 106 columns. Each column is 10 pixels wide, each row is 18 pixels high, and the renderer adds 16 pixels of padding on each side. The default image is 1092 pixels wide, which gives us a predictable size before any buildings are drawn.
With so many buildings beside each other, the gaps between them need some attention. I kept the two-cell positions and moved the left and right edges of each building background inward by one pixel. Neighboring buildings now have a two-pixel gap while keeping the same grid width. Alternating dark shades make the edges easier to see, and the windows keep the colors from GitHub’s contribution levels.
Next, look at the height calculation in CityBuilder. We add up the daily counts for each week and use the largest selected total to set the scale. I used a logarithmic scale because it gives quieter weeks enough height to show up alongside a very busy week:
int height = totals[i] == 0 ? 1
        : 1 + (int) Math.round(Math.log1p(totals[i]) / denominator
                * (options.maxHeight() - 1));
The denominator is Math.log1p(maximum), calculated once for the selected weeks. A week with zero contributions gets one window row directly. This also handles a completely inactive calendar, where every building takes that branch and the division is skipped.
Take weekly totals of 0, 3, and 20 with a maximum height of 14. They become buildings with 1, 7, and 14 window rows. You can still see the quiet week, although the difference between the heights is smaller than the difference between the counts. Read the heights as a broad view of weekly activity. For exact comparisons, use the counts in the calendar.
The weeks are selected before the scale is calculated. When you set weeks: '12', the tallest building is based on those twelve weeks. Activity earlier in the year stays outside that calculation. The total shown in the header comes from the full calendar returned by GitHub, so it continues to describe the full period even when you display fewer buildings.
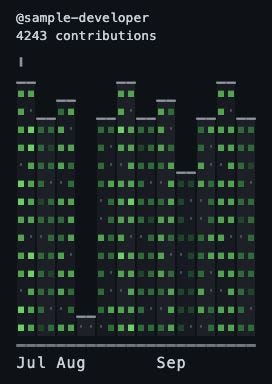
Now compare the two browser images again at about the width of your README. The full year shows the overall skyline, and the twelve-week view gives each building more space on screen. On a phone, those larger buildings make the windows easier to see. You can try another week count in PreviewTest, run ./mvnw verify again, and open the new image to choose a size for your profile.
Place the windows, roofs, and labels
The windows are filled from street level upward, with two windows on each floor. Inside the layout loop, the floor and column determine which day is used:
ContributionDay day = days.get((floor * BUILDING_WIDTH + column) % days.size());The modulo operation brings us back to the first day when all the returned days have been used. An inactive day is drawn as ·, and an active day as ▪, with its color taken from the contribution level. A partial week is handled in the same way, using the days GitHub returned for that week. Its building height is also based on those returned counts.
This gives us a repeating window pattern on taller buildings. A building with one floor has room for just two windows, while a taller building may show the same day several times. The windows should therefore be read as a pattern of activity. Keep the calendar counts for exact numbers. The repeated days are also explained in the SVG description, so the meaning is available to someone using assistive technology.
A roof is added above every building. The highest active week gets an antenna, with the most recent week chosen when totals are equal. If the whole calendar is inactive, the roof forms the top row of each building. Space for roofs and the antenna is added above the window rows, so the maximum height setting can be used fully for windows.
Month labels are placed below the street. For each week, we read the month from its first actual contribution day. This handles a partial first week whose nominal start belongs to the previous month. The English three-letter label is placed at that week’s column if there is room. If it would overlap another label or extend beyond the image, it is skipped and the building positions stay fixed.
Open short-4.svg to see what happens when the city becomes narrow. The header is allowed to grow vertically: long usernames wrap, preferably at a hyphen, and the contribution count uses total when the longer word will not fit. The complete text is kept in the accessible title. This lets the same layout rules cover both a full year and a small group of weeks.
Render the scene as SVG
With the positions settled, move to SvgRenderer. It reads the scene and applies either the github-dark or mono theme. The colors are stored in the SVG itself and checked as hex values. Text supplied by the user is XML-escaped, and a title and description are added for accessibility. The file is self-contained, with its appearance defined by SVG shapes, text, and the fonts available in the viewer.
Each character is given an explicit horizontal position. A browser may use a fallback font for one of the window or roof characters, and that character can have a different width. Setting the positions keeps later columns aligned even in that case. The exact character shapes can vary between viewers, so check your chosen theme in the browser where you read your profile.
The building backgrounds are grouped into one rectangle per building. Neighboring characters with the same color also share a text element. For the full synthetic sample, this gives us 53 building rectangles plus the background, in an SVG of about 41 KB. If you change the renderer, keep the full-year sample open alongside the shorter version so you can check both the file size and the drawing.
The same calendar, options, and theme produce the same SVG bytes. Layout and rendering depend only on these inputs. This lets the publishing workflow compare today’s file with the one already stored in the repository and create a commit only when the file changes.
You can follow these checks in the Java tests that run with ./mvnw verify. After the JAR is built, Maven Failsafe runs PackagedActionIT, which launches it through Java and JBang against a local server with saved calendar data. The test checks the SVG, action outputs, job summary, and request count. It also passes an invalid username to each launcher and checks that the action fails before a request is sent.
PublishingIT checks the publisher using a disposable local Git repository. It publishes a first image, the same image again, and a changed image, and checks that only the first and third calls create commits. Run ./mvnw verify after your layout changes so these checks run against the updated JAR. The validation notes contain the detailed local results and the checks to run on GitHub.
Add the city to your profile
To run the action on GitHub, publish the companion directory as the root of your action repository. The examples use myfear/quarkus-contribution-city; replace that name with the repository you created. You can then add the generation step to a workflow in your profile repository:
- name: Generate contribution city
  id: city
  uses: myfear/quarkus-contribution-city@main
  with:
    github-token: ${{ secrets.CONTRIBUTION_TOKEN || secrets.GITHUB_TOKEN }}
    username: ${{ github.repository_owner }}
    weeks: '53'
    height: '14'
    theme: github-dark
Set weeks and height to the values you chose from the local samples. Use a reviewed commit in place of main when you want to pin the action. The composite action builds the source at that revision and launches the resulting local uber JAR with JBang. That keeps the selected source and the executed code together. Allow time for the Maven build on each invocation; tests are run by the action repository’s CI with verify, and skipped during this runtime build.
The token determines which contributions GitHub returns. The repository token is used by default, and you can supply a suitable token as the CONTRIBUTION_TOKEN secret. For private and internal contributions, GitHub documents the optional read:user scope. Access also depends on the account settings and permissions described in the GitHub contribution schema.
During the run, the Java action checks its inputs, fetches the calendar, creates the scene, and writes contribution-city.svg. It reports the file through svg-path, exposes the calendar total as total-contributions, and adds a short job summary. The following workflow step can then use that file for publication.
Use the complete generation workflow to generate the image, or copy the publishing workflow into your profile repository’s .github/workflows/ directory to keep it on an output branch. The publisher compares the new SVG with the existing file and commits only a change. Changes are prepared in a temporary checkout and pushed normally, preserving the branch history. The daily schedule and contents: write permission are included in that workflow.
Run the workflow manually once and check that contribution-city.svg appears on the output branch. Then add this image link to your profile README, replacing both occurrences of USERNAME with your account name:
Open your profile to check the image at its actual display size. If the windows look too small, reduce the week count and run the workflow again. Once the layout fits, the daily schedule will keep the city up to date as your calendar changes.
You can also keep developing the city locally. Change the layout in CityBuilder, render the same sample calendar, and compare the images before using the change in your profile. I kept the scene as plain Java data so another renderer could use those same building positions later. For this version, that separation gives us a straightforward way to adjust the city and test each change before the workflow publishes it.