Quarkus Just Made Observability Easy: Auto-Load Grafana Dashboards from Your Source Code
Discover how Java developers can version, deploy, and visualize metrics and AI token usage with Grafana, Micrometer, and LangChain4j.
Modern enterprise teams expect observability to be built-in, not bolted on. Yet too often, developers instrument their applications but still rely on manual Grafana setup to visualize data. Quarkus 3.28 changes this dynamic by introducing Dashboards-as-Code — the ability to bundle custom Grafana dashboards directly in your Quarkus application.
These dashboards are automatically discovered and provisioned by Quarkus Dev Services for Observability, which can spin up Prometheus and Grafana in development mode. The result: a completely integrated local monitoring experience where your metrics and dashboards evolve together.
This tutorial walks through a fully runnable example project that visualizes Micrometer metrics and extends naturally to LangChain4j + Ollama for AI observability.
Why Observability-as-Code Matters
Monitoring is often the last step in development, handled by operations teams long after the code is deployed. The result is dashboard drift — visualizations that no longer reflect real metrics.
Quarkus 3.28 turns this into a first-class developer experience:
Dashboards live in your codebase. They can be reviewed, versioned, and deployed like any other artifact.
Grafana setup is automatic. Dev Services handle startup, provisioning, and Prometheus integration.
Metrics and dashboards evolve together. Every feature branch can include its own visualizations.
This approach treats observability like source code — a collaborative, automated, and version-controlled discipline.
Prerequisites
Make sure you have the following installed:
Java 17+
Quarkus CLI 3.28+
Podman or Docker (for Dev Services)
Optional: Ollama (for the AI example)
ollama pull llama3You can take a look at the full project and the dashboards in my Github repository.
Create a New Quarkus Project
We’ll start with a minimal Quarkus setup for metrics and observability.
quarkus create app com.example:observability-as-code \
  --extension='rest,quarkus-micrometer-opentelemetry,quarkus-observability-devservices-lgtm' \
  --no-code
cd observability-as-code
This includes:
Quarkus REST - for JAX-RS endpoints
Micrometer Prometheus for metric export.
Quarkus OpenTelemetry Exporter
Quarkus OpenTelemetry for Micrometer
Observability Dev Services to automatically start Prometheus and Grafana in development.
Add a Metric to Observe
Let’s simulate something measurable — visits to a website.
Create src/main/java/com/example/metrics/VisitResource.java:
package com.example.metrics;

import io.micrometer.core.instrument.MeterRegistry;
import jakarta.ws.rs.GET;
import jakarta.ws.rs.Path;
import jakarta.ws.rs.Produces;
import jakarta.ws.rs.core.MediaType;

@Path(”/visit”)
public class VisitResource {

    private final MeterRegistry registry;

    public VisitResource(MeterRegistry registry) {
        this.registry = registry;
    }

    @GET
    @Produces(MediaType.TEXT_PLAIN)
    public String visit() {
        registry.counter(”app.visits.total”).increment();
        return “Visit recorded!”;
    }
}
Every GET request to /visit increments the app.visits.total counter
Run and Verify the Monitoring Stack
Start Quarkus in dev mode:
quarkus devYou should see:
2025-11-16 10:19:28,425 [LGTM] STDOUT: Total startup time: 6 seconds
2025-11-16 10:19:28,426 [LGTM] STDOUT:
2025-11-16 10:19:28,426 [LGTM] STDOUT: Startup Time Summary:
2025-11-16 10:19:28,427 [LGTM] STDOUT: ---------------------
2025-11-16 10:19:28,427 [LGTM] STDOUT: Grafana: 2 seconds
2025-11-16 10:19:28,427 [LGTM] STDOUT: Loki: 2 seconds
2025-11-16 10:19:28,428 [LGTM] STDOUT: Prometheus: 1 seconds
2025-11-16 10:19:28,428 [LGTM] STDOUT: Tempo: 2 seconds
2025-11-16 10:19:28,428 [LGTM] STDOUT: Pyroscope: 2 seconds
2025-11-16 10:19:28,428 [LGTM] STDOUT: OpenTelemetry collector: 6 seconds
2025-11-16 10:19:28,429 [LGTM] STDOUT: Total: 6 seconds
2025-11-16 10:19:28,429 [LGTM] STDOUT: The OpenTelemetry collector and the Grafana LGTM stack are up and running. (created /tmp/ready)
2025-11-16 10:19:28,429 [LGTM] STDOUT: Open ports:
2025-11-16 10:19:28,429 [LGTM] STDOUT:  - 4317: OpenTelemetry GRPC endpoint
2025-11-16 10:19:28,430 [LGTM] STDOUT:  - 4318: OpenTelemetry HTTP endpoint
2025-11-16 10:19:28,430 [LGTM] STDOUT:  - 3000: Grafana. User: admin, password: admin
Open your browser at http://localhost:8080/visit a few times, then visit:
http://localhost:8080/q/metrics — raw Prometheus metrics
http://localhost:<PORT> — Grafana dashboard UI (find the Port in the Logfiles or use the DevConsole to find out)
Creating Dashboards-as-Code
Quarkus 3.28 introduces automatic provisioning of Grafana dashboards placed in:
src/main/resources/META-INF/grafana/When Quarkus Dev Services starts, it scans this directory and automatically imports each JSON file into Grafana.
How to Export a Grafana Dashboard as JSON
If you’ve designed a dashboard in Grafana and want to bundle it in your app:
Open your dashboard in Grafana.
Click the gear icon (Dashboard Settings) in the top-right.
Select JSON Model in the left sidebar.
Click Export → View JSON or Download JSON.
Save it in your project as:
src/main/resources/META-INF/grafana/grafana-dashboard-<MYCUSTOM_NAME>.jsonThat’s it — Quarkus will auto-provision this dashboard in Grafana every time you start in dev mode.
Example Dashboard for Visit Metrics
Create a dashboard file at:src/main/resources/META-INF/grafana/grafana-dashboard-visits.json
{
    “title”: “Visits Dashboard”,
    “tags”: [
        “Quarkus”,
        “Micrometer”,
        “Observability-as-Code”
    ],
    “panels”: [
        {
            “type”: “stat”,
            “title”: “Total Visits”,
            “targets”: [
                {
                    “expr”: “app_visits_total”
                }
            ]
        },
        {
            “type”: “timeseries”,
            “title”: “Visits Over Time”,
            “targets”: [
                {
                    “expr”: “rate(app_visits_total[1m])”
                }
            ],
            “fieldConfig”: {
                “defaults”: {
                    “unit”: “count/s”,
                    “color”: {
                        “mode”: “palette-classic”
                    }
                }
            }
        }
    ],
    “schemaVersion”: 41,
    “version”: 1
}
Restart Quarkus (CTRL+C then quarkus dev).
Go to Grafana → Dashboards → Visits Dashboard — and your visualization is ready.
Advanced Example: AI Observability with LangChain4j and Ollama
Let’s extend the project to track token usage for local LLM interactions using LangChain4j and Ollama.
Add Dependencies
Edit your pom.xml and add:
<dependency>
  <groupId>io.quarkiverse.langchain4j</groupId>
  <artifactId>quarkus-langchain4j-ollama</artifactId>
<version>1.4.0</version>
</dependency>
Configure Ollama
Append to application.properties:
# Ollama model configuration
quarkus.langchain4j.ollama.chat-model.model-id=llama3
quarkus.langchain4j.ollama.timeout=60s
Implement Token Tracking
The TokenMetricsRecorder class records token usage metrics for AI service calls. It observes AiServiceResponseReceivedEvent via CDI and extracts token usage from the response. It creates and maintains Micrometer counters for input tokens, output tokens, and total tokens, each tagged with the model name. Counters are cached in a ConcurrentHashMap and registered with the Micrometer registry for Prometheus export, enabling monitoring of token consumption across AI service invocations.
Create src/main/java/com/example/ai/TokenMetricsRecorder.java:
package com.example.ai;

import dev.langchain4j.observability.api.event.AiServiceResponseReceivedEvent;
import io.micrometer.core.instrument.Counter;
import io.micrometer.core.instrument.MeterRegistry;
import jakarta.enterprise.context.ApplicationScoped;
import jakarta.enterprise.event.Observes;
import org.eclipse.microprofile.config.inject.ConfigProperty;

import java.util.concurrent.ConcurrentHashMap;
import java.util.concurrent.ConcurrentMap;

@ApplicationScoped
public class TokenMetricsRecorder {

    private final MeterRegistry registry;
    private final String modelName;
    private final ConcurrentMap<String, Counter> counters = new ConcurrentHashMap<>();

    public TokenMetricsRecorder(
            MeterRegistry registry,
            @ConfigProperty(name = “llm.model.name”, defaultValue = “ollama-llama3”) String modelName) {
        this.registry = registry;
        this.modelName = modelName;
    }

    private Counter getOrCreateCounter(String name, String modelName) {
        String key = name + “:” + modelName;
        return counters.computeIfAbsent(key, k ->
            Counter.builder(name)
                    .tag(”modelName”, modelName)
                    .description(”Total number of “ + name.replace(”llm_token_”, “”).replace(”_tokens_total”, “”))
                    .register(registry)
        );
    }

    public void onAiServiceResponseReceived(@Observes AiServiceResponseReceivedEvent event) {
        var response = event.response();
        if (response == null || response.tokenUsage() == null) {
            return;
        }

        var usage = response.tokenUsage();

        getOrCreateCounter(”llm_token_input_count_tokens_total”, modelName)
                .increment(usage.inputTokenCount());

        getOrCreateCounter(”llm_token_output_count_tokens_total”, modelName)
                .increment(usage.outputTokenCount());

        getOrCreateCounter(”llm_token_count_tokens_total”, modelName)
                .increment(usage.totalTokenCount());
    }
}
Add AI Chat Service
Create src/main/java/com/example/ai/ChatService.java:
package com.example.ai;

import dev.langchain4j.service.UserMessage;
import io.quarkiverse.langchain4j.RegisterAiService;

@RegisterAiService
public interface ChatService {

    @UserMessage(”{prompt}”)
    String ask(String prompt);
}
Expose REST Endpoint
src/main/java/com/example/ai/ChatResource.java:
package com.example.ai;

import jakarta.ws.rs.GET;
import jakarta.ws.rs.Path;
import jakarta.ws.rs.Produces;
import jakarta.ws.rs.QueryParam;
import jakarta.ws.rs.core.MediaType;

@Path(”/ai”)
public class ChatResource {

    private final ChatService chatService;

    public ChatResource(ChatService chatService) {
        this.chatService = chatService;
    }

    @GET
    @Produces(MediaType.TEXT_PLAIN)
    public String chat(@QueryParam(”q”) String prompt) {
        return chatService.ask(prompt != null ? prompt : “Hello from Quarkus!”);
    }
}
Add AI Dashboard
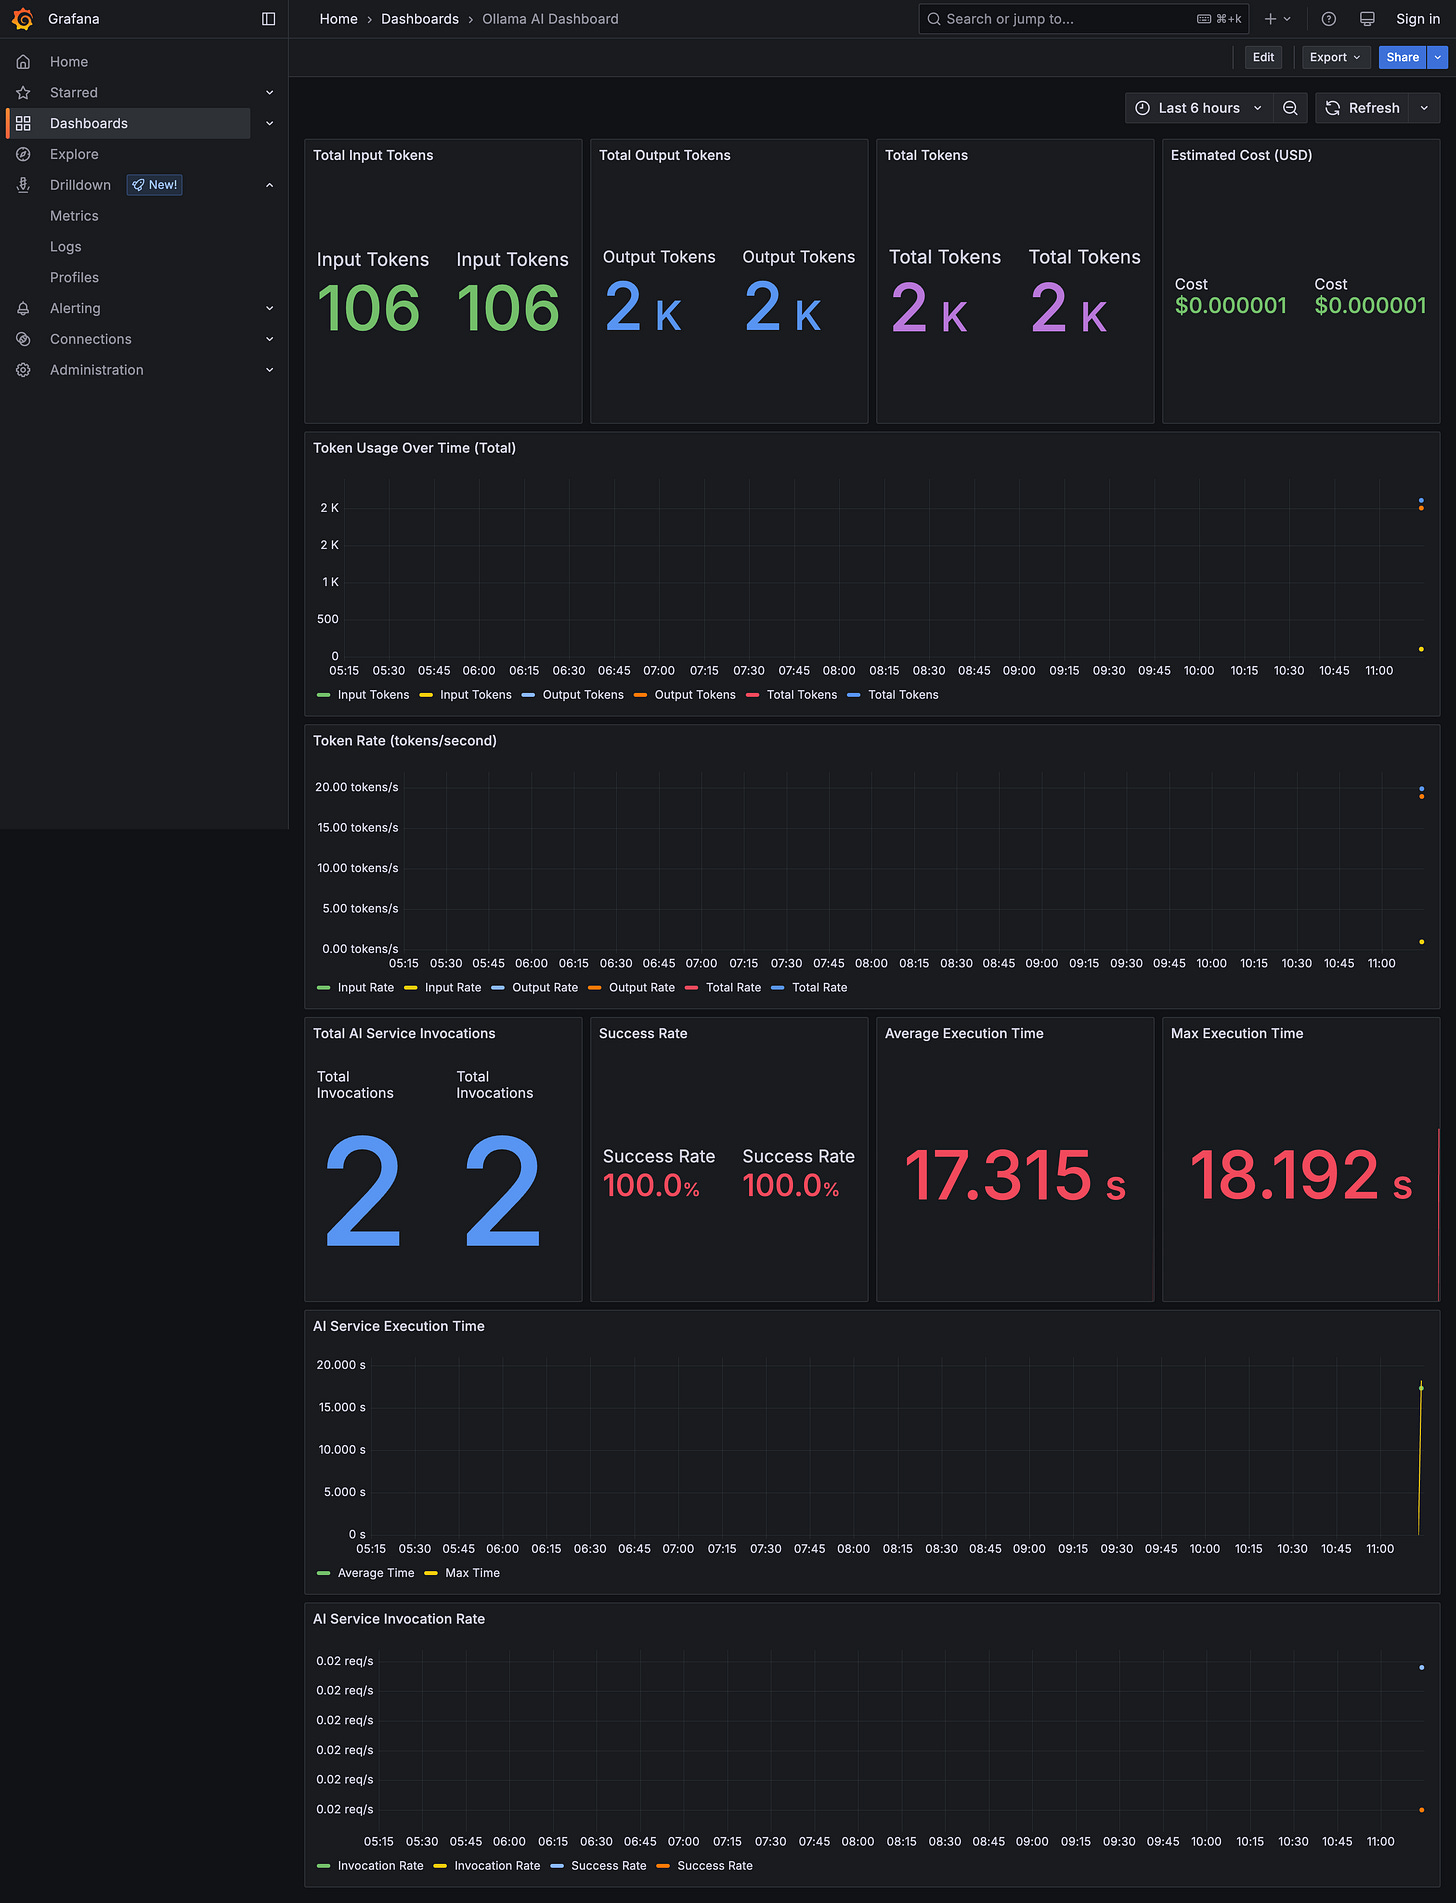
Create another dashboard file:src/main/resources/META-INF/grafana/grafana-dashboard-ollama-ai.json
{
    “title”: “Ollama AI Dashboard”,
    “tags”: [
        “Quarkus”,
        “LangChain4j”,
        “Ollama”,
        “AI”,
        “Micrometer”
    ],
    “panels”: [
        {
            “type”: “timeseries”,
            “title”: “Token Usage Over Time”,
            “targets”: [
                {
                    “expr”: “llm_token_input_count_tokens_total{modelName=\”ollama-llama3\”}”
                },
                {
                    “expr”: “llm_token_output_count_tokens_total{modelName=\”ollama-llama3\”}”
                }
            ]
        },
        {
            “type”: “stat”,
            “title”: “Total Token Count”,
            “targets”: [
                {
                    “expr”: “llm_token_count_tokens_total{modelName=\”ollama-llama3\”}”
                }
            ]
        },
        {
            “type”: “stat”,
            “title”: “Estimated Token Cost (USD)”,
            “targets”: [
                {
                    “expr”: “((llm_token_input_count_tokens_total{modelName=\”ollama-llama3\”}/1000000)*0.0005) + ((llm_token_output_count_tokens_total{modelName=\”ollama-llama3\”}/1000000)*0.0005)”
                }
            ]
        }
    ],
    “schemaVersion”: 41,
    “version”: 1
}
Restart Quarkus again. You’ll see both dashboards provisioned at startup.
Verify the Full Stack
Run everything together:
quarkus devThen curl:
curl "http://localhost:8080/ai?q=What+is+Quarkus?"Prometheus will capture new token metrics.
Grafana shows two dashboards:
Visits Dashboard for app traffic
Ollama AI Dashboard for LLM performance
All provisioned automatically.
Version Control and CI/CD
Once your dashboards live under META-INF/grafana, you gain:
Versioning: Each change is tracked in Git.
Reviewability: Dashboards evolve via pull requests.
Reproducibility: CI pipelines can export these dashboards to Grafana Cloud or internal observability stacks.
You can even automate this by adding a GitHub Actions step that publishes dashboards on each release.
Why This Is a Big Deal
Dashboards-as-Code eliminates the invisible gap between instrumentation and visualization.
With Quarkus, developers no longer need to wait for ops to create dashboards or risk mismatched configurations.
Everything, from metrics, to dashboards, to AI insights, is defined, tested, and deployed as part of the application.
Your Grafana dashboards now live with your code, not hidden in a browser tab.
That’s Observability-as-Code — powered by Quarkus.
Further Reading:


Really interesting in dev mode. It gives valuable insight during development.
I agree with Neural Foundry. TokenMetricsRecorder is a genuinely useful metric.
I am not sure it is a good idea to use that dashboard in production. We could deploy it through with a pipeline using the Grafana HTTP API, but I worry that might create friction with the platform team.
What do you think, Markus?