

How to Find Database Performance Problems with Quarkus, PostgreSQL MCP, and AI
A practical guide for Java developers to analyze slow queries, missing indexes, and database health using Quarkus and IBM Bob

Most Java developers think database performance problems are about slow queries. A missing index, a bad join, maybe an ORM issue. You run EXPLAIN ANALYZE, see something ugly, add an index, and move on.
That mental model works for isolated problems. It fails the moment the system runs under real load. Production databases are not slow because of one bad query. They are slow because of query patterns, contention, and feedback loops between the application and the database.
When latency increases, application threads wait longer. Connection pools fill up. Retries kick in. The database gets even more pressure. At this point, running EXPLAIN ANALYZE manually tells you almost nothing, because the problem is no longer a single query. The problem is behavior over time.
This is where most teams are blind. They have logs. They have metrics. But they don’t have a way to ask the database direct, structured questions while staying inside a developer workflow. This is exactly the gap we close in this article.
We’ll build a small Quarkus service, connect it to PostgreSQL, and then use a PostgreSQL MCP server through IBM Bob to inspect database health, query behavior, and missing indexes in a way that actually fits into daily development.
Prerequisites
You need a basic setup that most Java developers already have.
Java 21
Quarkus CLI
Podman
IBM Bob installed and working (or another MCP capable IDE)
You should be comfortable with Quarkus basics and SQL. No deep database internals required.
Project Setup
We start with a minimal Quarkus application that talks to PostgreSQL. And as usual, you can find all the configuration and examples in the corresponding Github repository.
Create the project:
quarkus create app com.example:db-performance-demo \
  --extension=quarkus-rest,quarkus-jdbc-postgresql,quarkus-hibernate-orm-panache
cd db-performance-demo
We keep the stack simple on purpose.
quarkus-restgives us HTTP endpoints to generate loadquarkus-jdbc-postgresqlsets up the JDBC driver and poolquarkus-hibernate-orm-panachelets us generate realistic query patterns
Now configure the datasource in application.properties:
quarkus.devservices.enabled=false

quarkus.datasource.db-kind=postgresql
quarkus.datasource.username=quarkus
quarkus.datasource.password=quarkus
quarkus.datasource.jdbc.url=jdbc:postgresql://localhost:5432/quarkus

quarkus.datasource.jdbc.min-size=5
quarkus.datasource.jdbc.max-size=20
quarkus.datasource.jdbc.acquisition-timeout=3s

quarkus.hibernate-orm.schema-management.strategy=drop-and-create
quarkus.hibernate-orm.log.sql=false
You do not need the datasource properties technically. Quarkus sets them for you. I want to make them explicit in this tutorial and we are going to spin up our own database instance later. This also means, I am disabling the Quarkus Dev services in this example. The acquisition timeout is especially important. Without it, slow queries turn into cascading failures.
A Simple Load Generator Endpoint
We need some database activity. Not benchmarks. Just something that behaves like a real service.
Rename the simple MyEntity to OrderEntity with below content:
package com.example;

import io.quarkus.hibernate.orm.panache.PanacheEntity;
import jakarta.persistence.Entity;

@Entity
public class OrderEntity extends PanacheEntity {

    public String customerId;

    public double amount;
}
Now rename the GreetingResource to OrderResource and make it a REST endpoint that creates load:
package com.example;

import java.util.UUID;

import jakarta.transaction.Transactional;
import jakarta.ws.rs.GET;
import jakarta.ws.rs.Path;

@Path("/orders")
public class OrderResource {

    @GET
    @Path("/create")
    @Transactional
    public String createOrder() {
        OrderEntity order = new OrderEntity();
        order.customerId = UUID.randomUUID().toString();
        order.amount = Math.random() * 1000;
        order.persist();
        return "ok";
    }

    @GET
    @Path("/find")
    public long findOrders() {
        return OrderEntity.count("amount > 100");
    }
}
This code is intentionally boring. That’s the point. We want realistic ORM-generated SQL, not hand-optimized queries.
Installing PostgreSQL Performance Extensions
Before we analyze anything, PostgreSQL needs to expose the right data. Two extensions matter here.
pg_stat_statements
This extension tracks which queries run, how often, and how expensive they are.
CREATE EXTENSION IF NOT EXISTS pg_stat_statements;Without this extension, you are blind. You only see single queries, not patterns.
hypopg
This extension lets you create hypothetical indexes. The database pretends the index exists and tells you if it would help, without actually creating it.
CREATE EXTENSION IF NOT EXISTS hypopg;This is critical in production-like environments. You can test indexing strategies without risking write amplification or lock contention.
Before we can actually do this, we need to start PostgreSQL. Let’s do this with a compose-devservices.yml file:
services:
  postgres-primary:
    image: postgres:17
    container_name: postgres
    environment:
      POSTGRES_DB: quarkus
      POSTGRES_USER: quarkus
      POSTGRES_PASSWORD: quarkus
    ports:
      - "5432:5432"
    volumes:
      - ./postgresql.conf:/etc/postgresql/postgresql.conf
      - primary_data:/var/lib/postgresql/data
    command: >
      postgres
      -c config_file=/etc/postgresql/postgresql.conf
    healthcheck:
      test: pg_isready -U quarkus -d quarkus
      interval: 5s
      timeout: 3s
      retries: 3

volumes:
  primary_data:
And also make sure to create the postgresql.conf
# Network settings
listen_addresses = '*'
shared_preload_libraries = 'pg_stat_statements'
Now you can start the instance:
podman compose -f compose-devservices.yml up -dAnd while we have it running, let’s install hypopg. If you are using a cloud hosted or a company instance, this should already be available, but for this example, we build it out completely:
podman exec -it postgres bash -c "apt-get update && apt-get install -y postgresql-17-hypopg"That’s pretty much it. Let’s now also add the two extensions to the resources/import.sql file:
CREATE EXTENSION IF NOT EXISTS pg_stat_statements;
CREATE EXTENSION IF NOT EXISTS hypopg;
Ok, now we can start the application:
quarkus devAnd hit the create endpoint a couple of times.
for i in {1..20}; do curl http://localhost:8080/orders/create; doneAlso let’s find some orders with amount > 100:
curl http://localhost:8080/orders/findConnecting PostgreSQL MCP to IBM Bob
Now comes the interesting part. Let’s use the PostgreSQL MCP server.
First we have to pull the image.
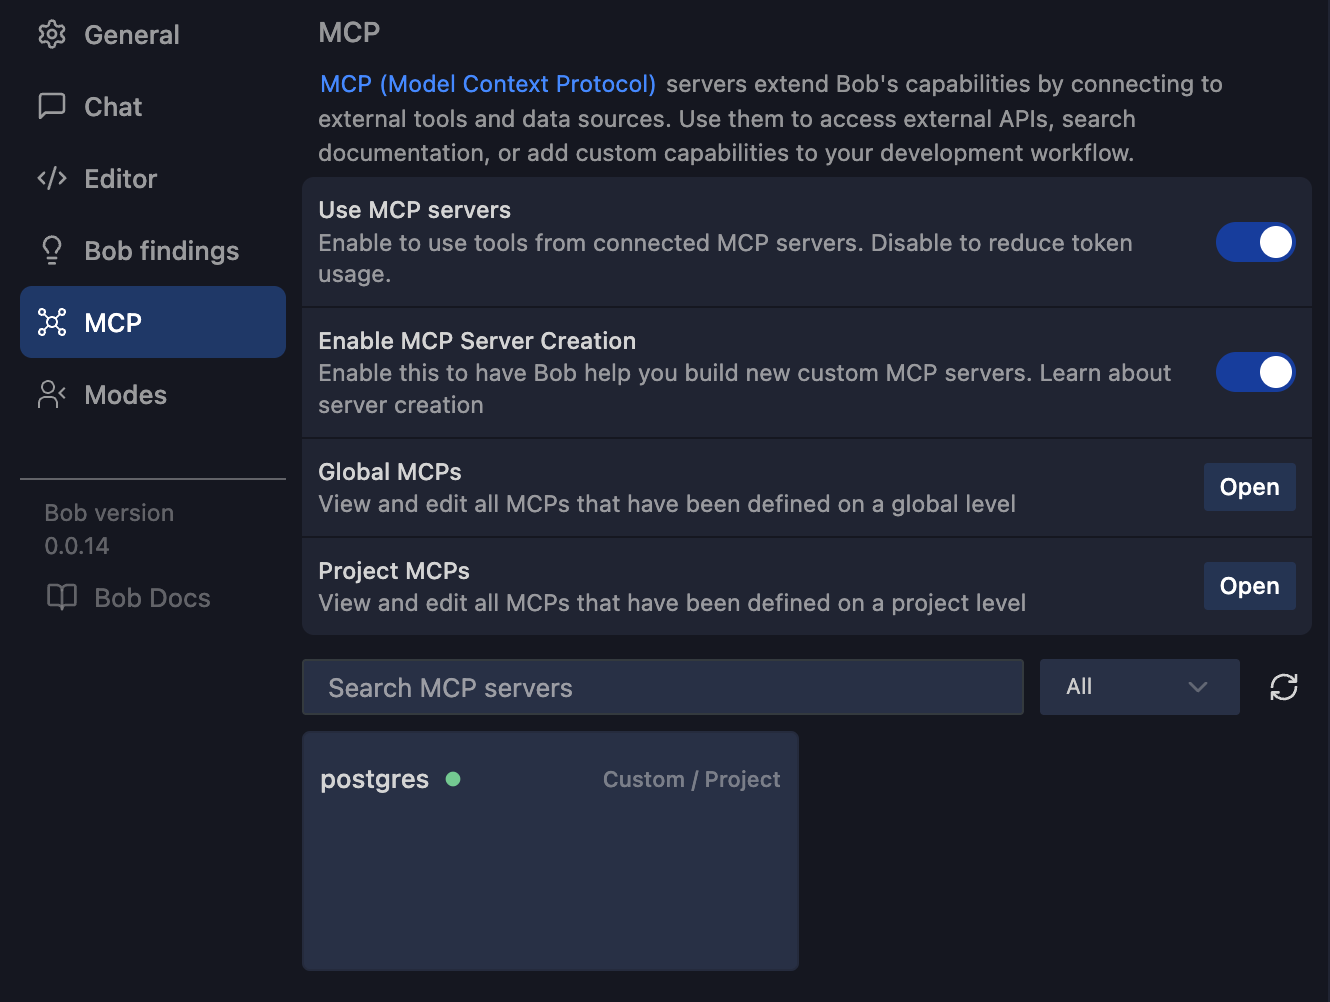
podman pull crystaldba/postgres-mcpWe connect a PostgreSQL MCP server to the database and let IBM Bob ask questions on our behalf. Open Bob and navigate to the MCP Server Settings. Add a Project MCP:
{
  "mcpServers": {
    "postgres": {
      "command": "podman",
      "args": [
        "run",
        "-i",
        "--rm",
        "--network=host",
        "crystaldba/postgres-mcp",
        "--access-mode=unrestricted",
        "--transport=stdio",
        "postgresql://quarkus:quarkus@host.containers.internal:5432/quarkus"
      ],
      "alwaysAllow": [
        "analyze_db_health",
        "list_schemas"
      ]
    }
  }
}
A few important details here.
We run the MCP server via Podman.
--network=hostis required so the container can reach PostgreSQL.--access-mode=unrestrictedallows deeper inspection. Use this carefully.The connection string matches our Quarkus datasource.
Once this is configured, IBM Bob can talk to PostgreSQL through MCP. Not through logs. Not through dashboards. Directly.
And Bob also directly starts the mcp server.
Inspecting Database Performance via MCP
Now let’s actually use it.
From IBM Bob, ask for support with database health analysis.
"Hey Bob, check my database health!”
The MCP server exposes structured actions like analyze_db_health.
What you get back is not a vague summary. You get concrete signals:
Slowest queries by total execution time
Queries with high variance
Missing or inefficient indexes
Table bloat
Cache hit ratios
But for the simple example we build, Bob shares only good news:
✅ Performance
Index cache hit rate: 100% (excellent - above 95% threshold)
Table cache hit rate: 100% (excellent - above 95% threshold)
Let’s add some more methods to the OrderResource
// SLOW QUERY 1: Full table scan with LIKE on unindexed column
    @GET
    @Path("/search/{customerId}")
    @Produces(MediaType.APPLICATION_JSON)
    public List<OrderEntity> searchByCustomerId(@PathParam("customerId") String customerId) {
        // This will do a full table scan because customerId is not indexed
        // and LIKE with leading wildcard prevents index usage
        return OrderEntity.list("customerId LIKE ?1", "%" + customerId + "%");
    }

    // SLOW QUERY 2: Complex aggregation without proper indexes
    @GET
    @Path("/expensive-aggregation")
    @Produces(MediaType.APPLICATION_JSON)
    public long expensiveAggregation() {
        // This performs multiple aggregations on unindexed columns
        // Counts customers who have more than one order with amount > 100
        return OrderEntity.count(
            "SELECT COUNT(DISTINCT customerId) " +
            "FROM OrderEntity " +
            "WHERE amount > 100 " +
            "GROUP BY customerId " +
            "HAVING COUNT(*) > 1"
        );
    }

    // SLOW QUERY 3: Range query on unindexed column
    @GET
    @Path("/range/{min}/{max}")
    @Produces(MediaType.APPLICATION_JSON)
    public List<OrderEntity> findByAmountRange(
            @PathParam("min") double min,
            @PathParam("max") double max) {
        // Range queries on unindexed columns require full table scan
        return OrderEntity.list("amount BETWEEN ?1 AND ?2", min, max);
    }

    // SLOW QUERY 4: Sorting on unindexed column with large result set
    @GET
    @Path("/sorted-by-amount")
    @Produces(MediaType.APPLICATION_JSON)
    public List<OrderEntity> sortedByAmount() {
        // Sorting requires loading all data and sorting in memory
        // without an index on amount
        return OrderEntity.list("ORDER BY amount DESC");
    }
Now run them with more data:
/orders/search/{customerId} - Full table scan with LIKE
Uses
LIKE '%value%'on unindexedcustomerIdcolumnLeading wildcard prevents index usage
curl http://localhost:8080/orders/search/abc-123/orders/expensive-aggregation - Complex aggregation
Multiple aggregations (COUNT, AVG, SUM, MAX) on unindexed columns
GROUP BY and HAVING clauses without indexes
curl http://localhost:8080/orders/expensive-aggregation/orders/range/{min}/{max} - Range query on unindexed column
BETWEEN query on unindexed
amountcolumn
curl http://localhost:8080/orders/range/100/500/orders/sorted-by-amount - Sorting without index
ORDER BY on unindexed
amountcolumn
curl http://localhost:8080/orders/sorted-by-amountBonus - Bulk data creation:
# Create 10,000 orders to make queries slower
curl http://localhost:8080/orders/bulk-create/10000
Instead of guessing why the /orders/find endpoint slows down, you can see that the same query runs thousands of times, scans the table, and would benefit from an index on amount.
Now test it safely with hypopg.
You ask Bob to create a hypothetical index on amount. PostgreSQL evaluates the execution plan again. No locks. No schema change.
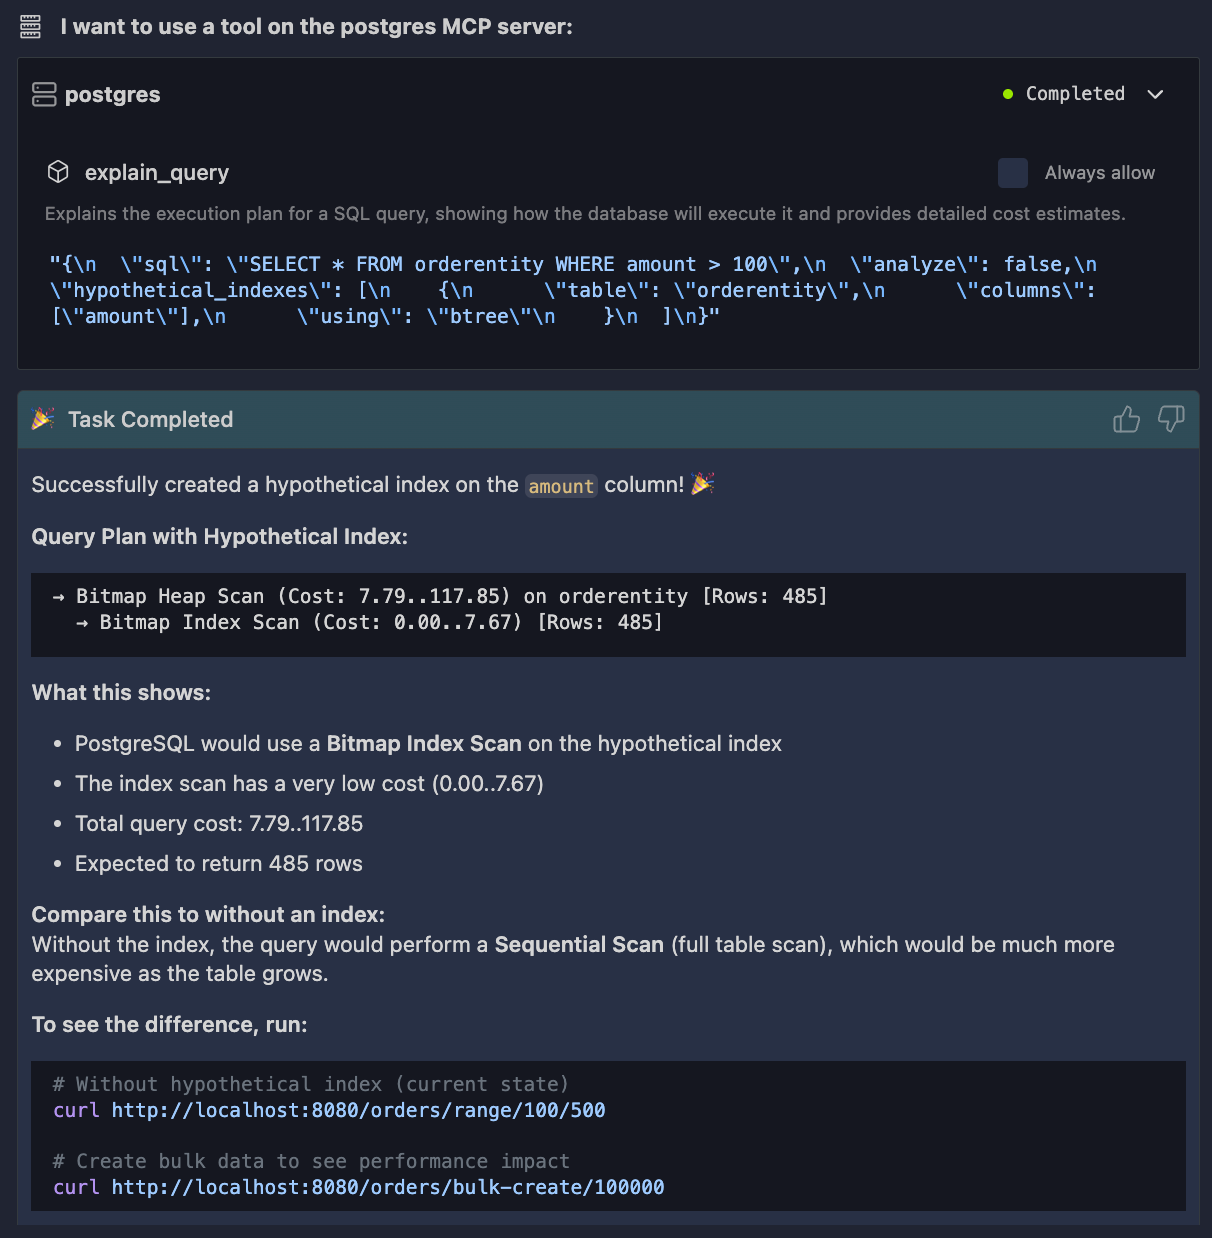
You immediately see whether the index helps.
This feedback loop is the key difference. You are no longer tuning SQL in isolation. You are tuning behavior, with real data, inside the same workflow where you write Java code.
Conclusion
We built a simple Quarkus service, enabled PostgreSQL’s internal performance tracking, and connected it to IBM Bob through a PostgreSQL MCP server. This setup makes database performance observable in a way that matches how developers actually work.
The important shift is this: database performance is not about fixing one slow query. It’s about understanding patterns, pressure, and feedback loops between your Java code and PostgreSQL, and MCP gives you a direct way to inspect that reality.